US S&P500: Volatile but without direction

US S&P500 - 26/08/19

Short Term strategy: Neutral (50/100)
Long Term strategy: Positive (70/100)

Scores computed by our proprietary algorithms - cf methodology

indice profile

The top 10 stocks of the S&P500 include five major technology stocks (Apple, Amazon, Microsoft, Alphabet and Facebook), but also larger, more classic and iconic American companies such as JP Morgan or Exxon Mobil.

The main benefit of this index is its depth, which allows it to be a good proxy for the US economy, with a sector weighting that favors the growth sectors a little more, just like the technology stocks that represent about 26% of the weighting. Financial stocks account for c.16% of the index and energy stocks around 5% are well balanced by defensive & growth sectors such as health (around 14%) and consumer discretionary (13%).

After a 19.4% rise in 2017, the S & P500 posted a 6.2% drop in 2018 due to expectations of an economic downturn related to the worsening trade war between the US and China and a at the same time, interest rate increases by the FED.

The index rebounded 13.6% in 2019 due to a change of course of the FED which envisages lowering rates to support the economy and massive share buybacks of companies that support earnings per share.

However, the index is now loosing momentum due to the reactivation of the trade war with China raises the risks to the global economy, not to mention a risk of conflict in the Middle East.

The S&P500 is well valued at 17x earnings, leaving little room for disappointment over corporate earnings growth over the next 12 months.

Instruments : SPY (SPDR in USD), SP5 (Lyxor in Euro), IVV (iShares, in USD)

Technical analysis

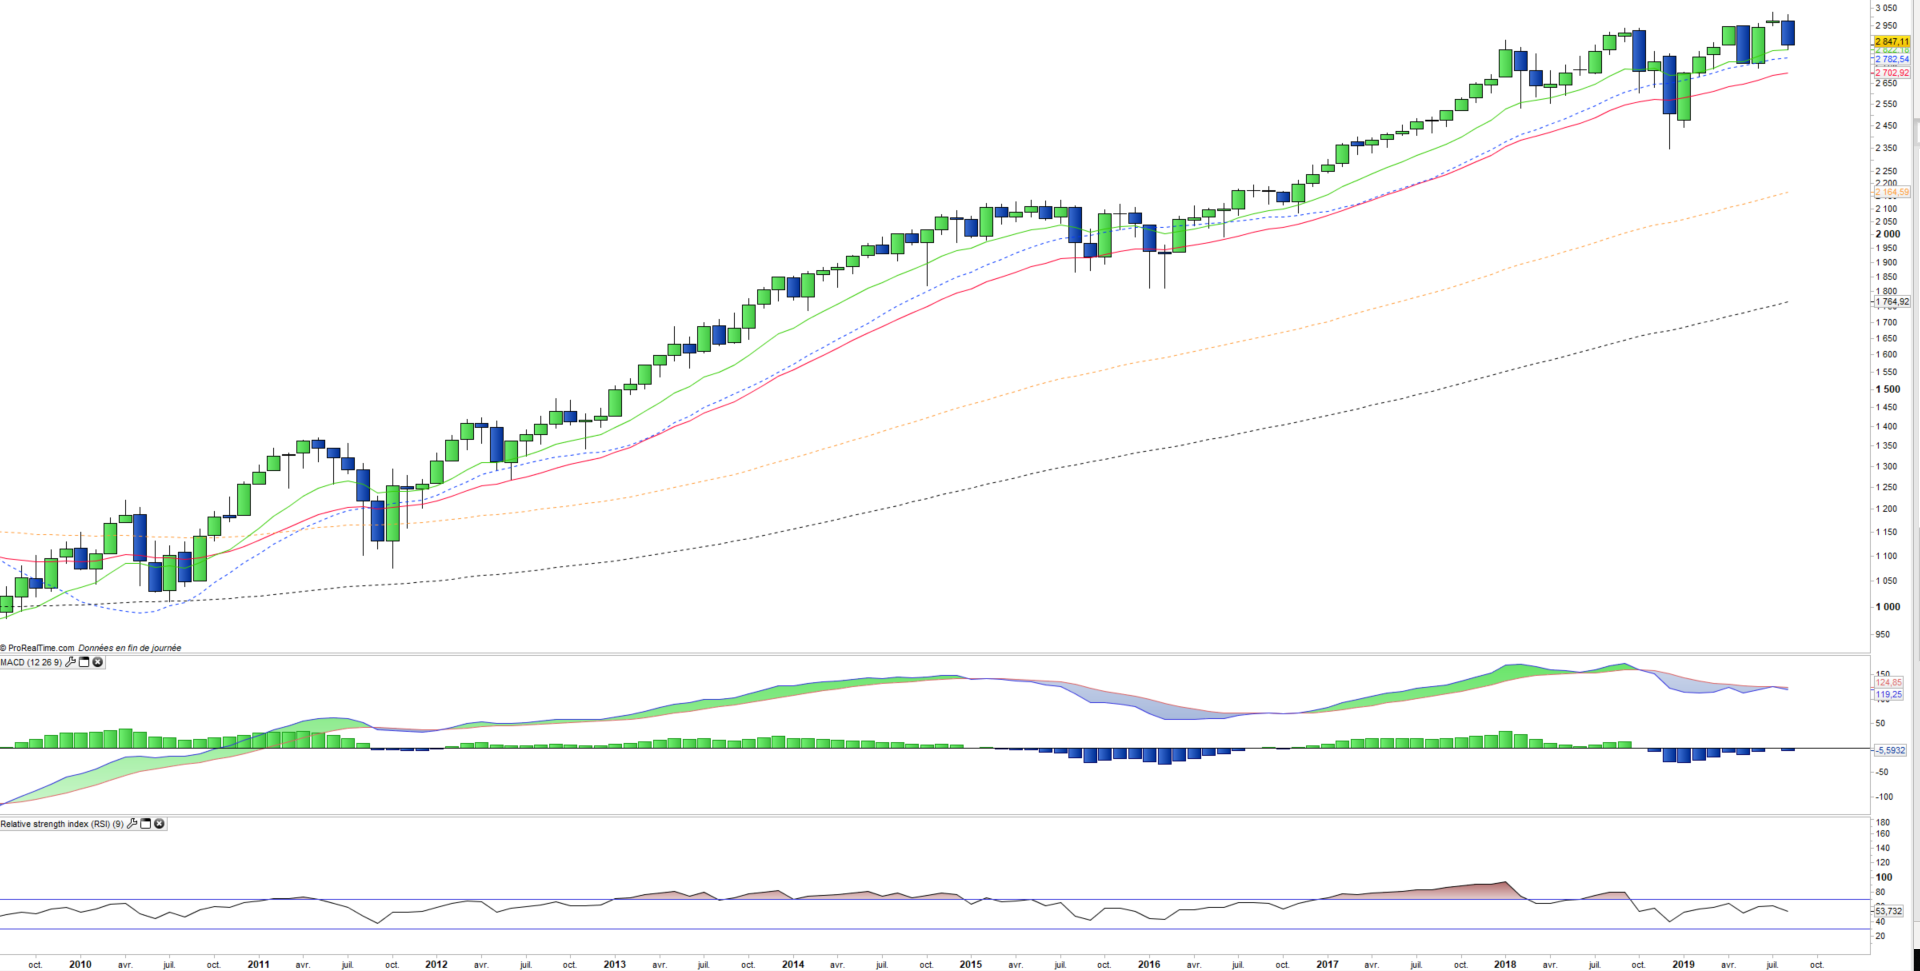
Monthly data analysis

The monthly chart shows an index that has become more chaotic and has trouble making new highs. The flagship index has been stable overall for the past two years, with volatile episodes but without impacting the long-term trend, which remains clearly bullish despite a certain run-down. A 3000pts-2500pts trading range could be put in place, if the new attack in progress came to be confirmed in the coming weeks.

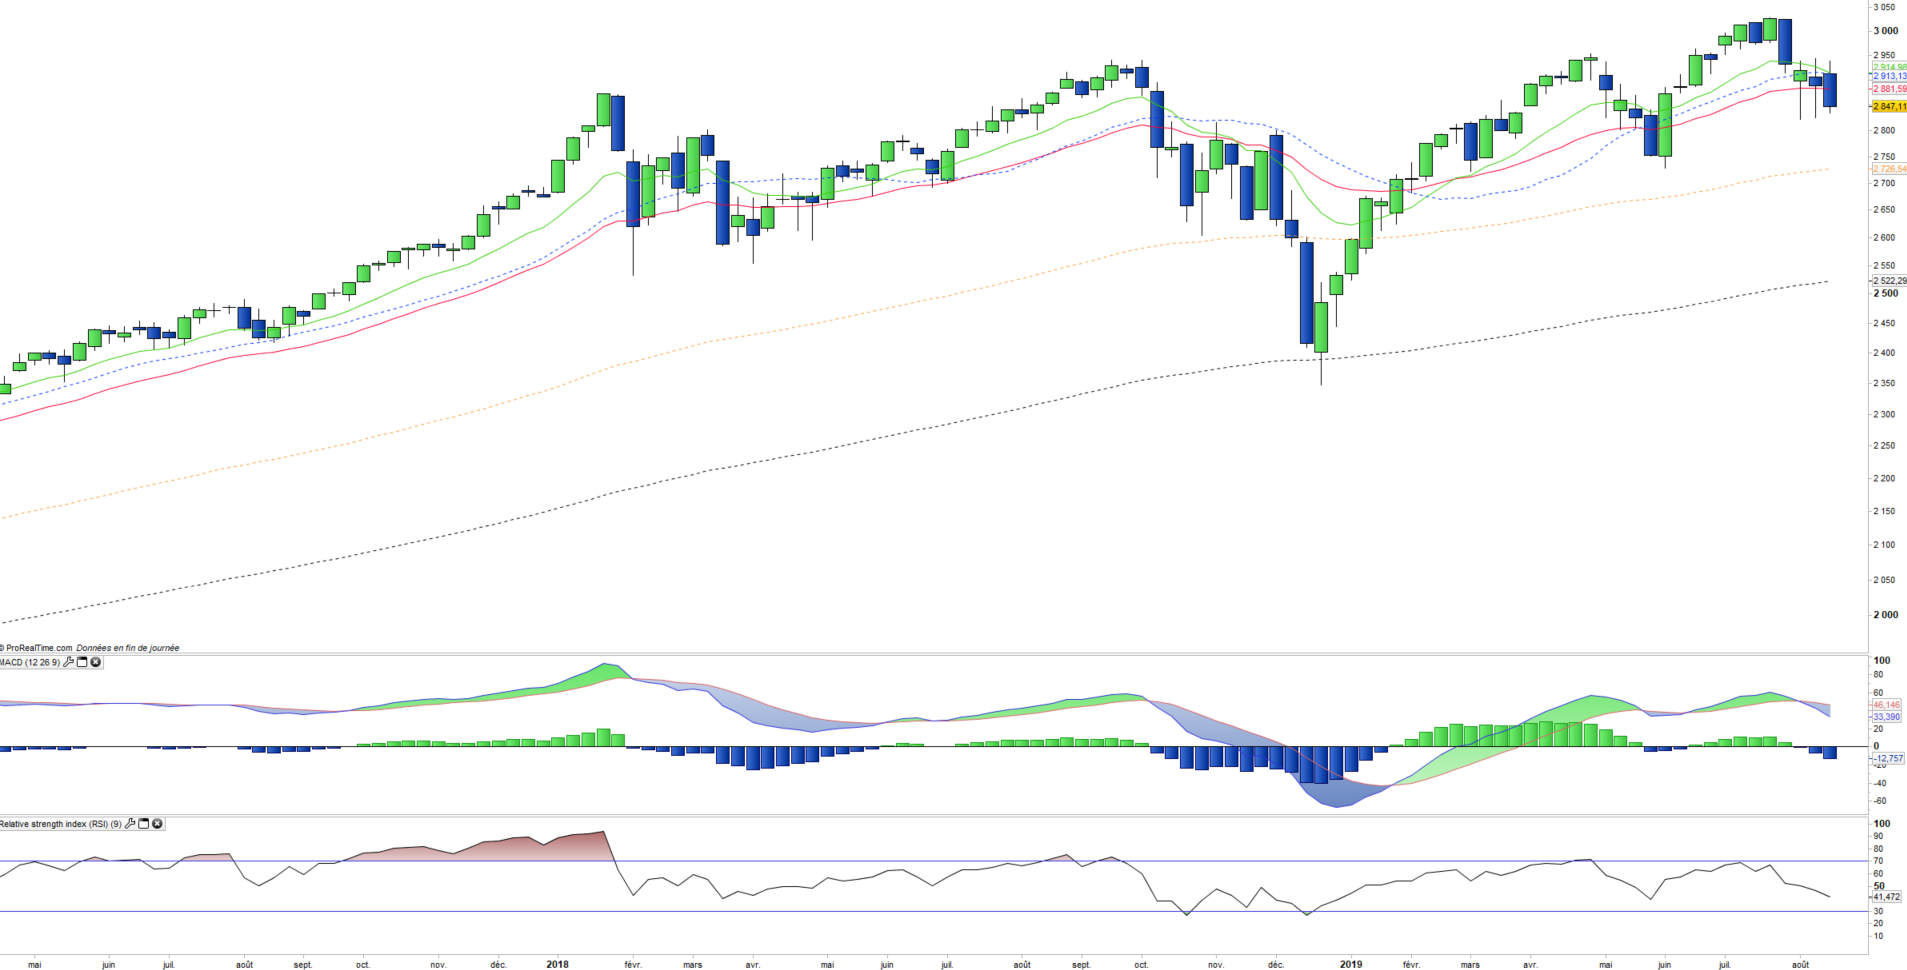
Weekly data analysis

On the weekly chart, we can identify a new bearish start similar to those of last June and previously in 2018. It could be a false start as in June or the first quarter of 2018, but if the correction came to s 'deepen as last autumn, then the EMA100 then EMA200 inevitably constitute the first targets. In the very short term, a closing below the 2 previous wicks would be ominous.

Country breakdown

USA 100%

Sector breakdown

Information technology 22%
Health Care 14%
Financials 13%
Consumer discretionary 10%
Communication services 10%
Industrials 9%
Consumer staples 8%
Others 14%

Top Ten holdings

Microsoft  4%
Apple 4%
Alphabet 3%
Amazon 3%
Berkshire Hathaway 2%
Facebook 2%
Johnson & Johnson 1%
JPMorgan Chase & Co 1%
Visa 1%