
Short Term and Long Term trends by Asset classes:
| Asset Classes | Indices / ETFs | Short Term trend | Long Term trend | |||||||
| World Equities | index ACWI - ACWI | Positive | Positive | |||||||
| USA Equities | S&P500 USA - SP5 | Positive | Positive | |||||||
| USA Equities | Nasdaq 100 USA - NDX | Positive | Positive | |||||||
| USA Equities | Russel 2000 USA - RS2K | Neutral | Positive | |||||||
| Europe Equities | Euro STOXX 600 - MEUD | Positive | Positive | |||||||
| Europe Equities | Small Cap Europe - MMS | Positive | Positive | |||||||
| UK Equities | FTSE 100 - L100 | Positive | Positive | |||||||
| Japan Equities | Japan Topix - JPN | Positive | Positive | |||||||
| Asia Pacific ex Japan Equities | Lyxor ETF - AEJ | Positive | Positive | |||||||
| China Equities | Amundi ETF China - CC1 | Positive | Positive | |||||||
| Latin America Equities | Lyxor ETF Latam - LTM | Positive | Positive | |||||||
| Africa Equities | Lyxor Pan Africa - PAF | Positive | Positive | |||||||
| Govt Bonds EUROMTS 7-10 Years | Amundi ETF- C73 | Positive | Positive | |||||||
| Corporate Bonds Euro | Amundi ETF - CC4 | Positive | Positive | |||||||
| Emerging Countries Bonds | Amundi ETF - AGEB | Positive | Positive | |||||||
| US Treasury Bonds 7-10 years | Amundi ETF - US7 | Positive | Positive | |||||||
| Corporate US Bonds | Lyxor ETF - USIG | Positive | Neutral | |||||||
| Golds | ETFS - BULLP | Positive | Positive | |||||||
| Agricultural Commodities | ETFS - AIGAP | Negative | Negative | |||||||
| Energy Commodities | ETFS - AIGE | Neutral | Negative | |||||||
| Industrial Metals Commodities | ETFS - AIGI | Positive | Positive | |||||||
Methodology:
Crash indicator
Our indicator is calculated based on quantitative criteria that qualify crash's risk based on the volatility market behavior (VIX), gold, US bonds (10 years) and the MSCI World. We adopt weightings of these different criteria in order to assess the market risk and its evolution on a weekly basis.
Short Term and Long Term Scores
The scores are calculated by our algorithms on the basis of quantitative criteria over several time horizons. These scores are between 0 and 100. Beyond 50 points the momentum is considered positive, under 50 points the momentum is negative, and the 50 points represent a neutral score. Dynamically, all comparisons are based on scores calculated one week earlier

Equities:
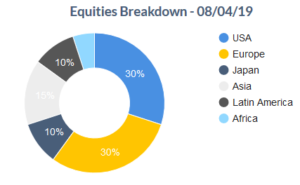
Full box for Equities: All areas are in positive short-term and long-term trends, with the exception of Russel 2000 (US broad index), which is only in short-term neutral territory.
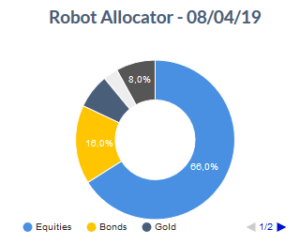
Our Global Global Macro portfolio therefore includes all geographies in its Allocation, for a total of 66% of equities.
Bonds:
This time the bonds weaken very slightly in the short term, which is consistent with the surge in equities. Bonds remain well oriented in both the short and long term.
All categories of Bonds are currently eligible in our Global Macro portfolio, which therefore includes 16% of Bonds in its allocation.
Gold:
Gold is weakening in the short term, reflecting a decrease in market tensions consistent with the rise in equities. But the short-term and long-term Gold scores, always showing positive trends, allow us to keep it in our Global Macro portfolio (7% of the portfolio).
Commodities:
Only Industrial Metals have a positive short-term and long-term trend, with unchanged scores compared to the previous week. These are therefore included in our Global Macro portfolio (3% of the total portfolio).
Agricultural Commodities and Energy are excluded from our portfolio, as they were the week before, as they remain in a negative long-term trend.
Cash:
In the Global Macro portfolio, we hold 8% of cash.