

Risk of Krach :
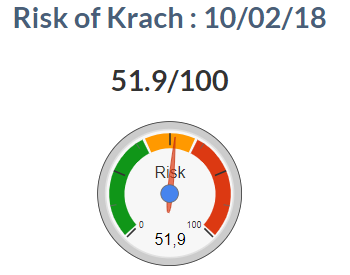
Our Krach indicator is undergoing a significant upward surge from 35.5 / 100 to 51.9 over the week, which signals a sharp rise in in the short term risk, and involves a cash level of around 15%. in the portfolios (which starts from the crossing of the 40 pts level on the indicator).
The peak of volatility was recorded last Monday, the VIX exceeding 50 points in intraday, with a replica Thursday before returning below the level of 30 at the end of the week. This downward trend over the week probably implies that a rebound will intervene on the oversold stock markets next week, which does not mean that it is the end of the correction. A possible rebound will allow one to build a liquidity pocket if it is not already done.
The MSCI World fell sharply this week (-5%) or 9% in 2 weeks. This brutal correction is neither a Krach (there is no rebound during a Krach and the amplitude of the decline is more important) nor a reversal of the trend, which remains positive in the long term on all indicators.
However, the brutality of the movement could have consequences for the future by greatly weakening the underlying trend of equity markets and make it more vulnerable to a reversal or a relapse. All asset classes, including gold, fell this week, while bonds remained fairly stable with 10-year US rates remaining around 2.85%, so liquidity went into cash at first.
Robot Allocator :
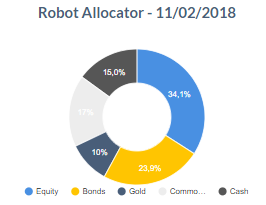
Our Robot Allocator changes the weighting on the various asset classes quite significantly this week, which is explained by the sudden market correction and the sharp rise in volatility. The cash position goes up to 15% because of a Krach indicator that goes well above the trigger level (score at 51.9). In addition, the bonds pursue the same logic of fragmentation, but the scarcity of categories in favorable trend has triggered a downward revision of the weighting of the bonds in the Global portfolio.
Over the past week, the biggest variations in scores have taken place on equities, in a fairly global way in terms of sectors and geographies. However, it is interesting to note that the impact of the correction is essentially short-term, and does not give rise to arbitrage within this asset class because the long-term notes remain unchanged or at least not enough that the positive trend is called into question. This supports us in our analysis of the sequence, namely that a sudden correction is underway but that it is not a Krach (because there are rebounds and the fall of the order of 10% since the peaks is too weak) or a reversal of trend, at least for the moment.
The fall also had a major impact on commodities, in a magnitude close to that of equities, and mainly concerns metals, but without breaking the short-term rebound dynamics of certain agricultural commodities such as corn, wheat or cocoa.
At the Bonds level, the general trend has again deteriorated in high-yield bonds and US, European and emerging-market sovereign bonds, although there is good resilience among Senior Loans and some corporate quality bonds. A rebound is possible this week on the different asset classes, which will not mean the end of the correction, which could leave traces for a certain time given its intensity.
Volatility is expected to return permanently, which also justifies a share of liquidity in the portfolios.
Annalysis by Asset Classes
Equities :
New sharp drop in the short-term share price at 33/100 (-59% over 2 weeks). It should be noted, however, that all geographical areas retain a Long Term score greater than 50/100 (positive momentum)
South America is the zone that stands up the best: it is the only one that manages to keep a short term score reflecting a positive momentum (> 50), at 58/100.
Few national indices manage to maintain a positive short-term momentum. Finland (EFNL), Indonesia (EIDO), Chile (ECH), Colombia (ICOL), Saudi Arabia (KSA), South Africa (EZA), Brazil (RIO) and in Europe Greece (GRE), whose good resistance we have already mentioned.
In Europe alone the Automotive sector manages to maintain a positive short-term momentum, with a score of 60/100 for the ETF AUT.
Conversely, several sectors now have a negative long-term score (<50/100): Food & Beverage (FOO), Health (HLT), Media (MDA), Personal & Household Goods (PHG), Telecom (TEL ) and Utilities (UTI).
Bonds :
We have reduced the share of the Bonds, because with the tensions on the rates the opportunities are more rare. This time the Bonds have turned into negative momentum, both in the short term (score 21/100) and long term (score 46/100).
High Yield is on the mat in Short Term (score 8/100), and negative in Long Term (score 40/100)
Nevertheless, some bond ETFs are able to float, such as SPDR Blackstone Senior Loan (SRLN), PowerShares International Corporate Bond (PICB), SPDR Barclays International Treasury Bond (SPDR) and IGOV (iShares International Treasury Bonds), all of which retain a Short Term score of 80/100, and a Long Term score of 50/100 (neutral for SRLN) at 100/100 for the 3 others.
Oil :
Oil, despite its fall last week, remains in a bullish momentum with a short term score of 80/100 for the ETF DBO (PowerShares WTI). However, its course is approaching key supports and next week will be important, as a further decline would shift its COurt Term and Long Term scores into the red.
Commodities :
Base metals have this time suffered from the market downturn, with a short-term score returning to the 51/100 equilibrium zone. The long-term trend is not threatened at the moment with a score that shows a bullish momentum at 77/100 (-5 points only over 2 weeks)
Platinum (PGM: iPath Bloomberg Platinum), Nickel (JJN: iPath Bloomberg Nickel) and especially Tin (JJT: iPath Bloomberg Tin) maintain a bullish momentum in the short term.
Commodities were also affected by the correction, with a short-term score returning to the short-term bearish momentum zone, with a score of 38/100. The Long Term trend also remains negative, with a score of 29/100. It should be noted, however, that Cotton (BAL: iPath Bloomberg Cotton), with a short term score of 60/100, and Cocoa (NIB: iPath Bloomberg Cocoa) with a short term score of 80/100 manage to stay in positive territory. Corn (Teucrium CORN) and wheat (Teucrium WEAT) remain in the neutral zone (50/100).
Gold :
Gold (IAU - iShares Gold Trust) remains well oriented, both Short Term (score of 80/100) and Long Term (score of 100/100), even if the yellow metal has not completely played its part. safe haven role during the correction last week.
Short Term scores and Long Term scores by Asset classes :
| SHORT TERM | LONG TERM | |||||||
| Asset Allocation | W | W-2 | variation | W | W-2 | variation | ||
| Equities Score | 33 | 91 | -59 | 75 | 88 | -13 | ||
| Gold Score | 80 | 100 | -20 | 100 | 100 | 0 | ||
| Oil Score | 80 | 100 | -20 | 50 | 70 | -20 | ||
| Commodities Score | 43 | 72 | -29 | 48 | 53 | -5 | ||
| Bonds Score | 21 | 46 | -25 | 46 | 59 | -13 | ||
| SHORT TERM | LONG TERM | |||||||
| Equities Scores | W | W-2 | variation | W | W-2 | variation | ||
| US Equities | 42 | 96 | -55 | 84 | 93 | -9 | ||
| Europe Equities (sectors) | 16 | 76 | -60 | 65 | 88 | -22 | ||
| South Europe Equities (Countries) | 30 | 98 | -68 | 70 | 93 | -23 | ||
| Asia Equities | 38 | 96 | -58 | 94 | 98 | -4 | ||
| South America Equities | 58 | 94 | -36 | 77 | 84 | -7 | ||
| Middle East - Africa Equities | 42 | 92 | -50 | 61 | 72 | -11 | ||
| SHORT TERM | LONG TERM | |||||||
| Bonds score | W | W-2 | variation | W | W-2 | variation | ||
| High Yield | 8 | 48 | -40 | 40 | 63 | -23 | ||
| SHORT TERM | LONG TERM | |||||||
| Commodities Scores | W | W-2 | variation | W | W-2 | variation | ||
| Metals | 51 | 94 | -43 | 77 | 82 | -5 | ||
| Agricultural commodities | 38 | 54 | -16 | 29 | 31 | -3 | ||
Top 5 short term fall :
| Short Term | 2 weeks | ||
| ETF | Ticker | score | variation |
| Lyxor IBEX 35 (DR) UCITS ETF | LYXIB | 0 | -100 |
| SPDR S&P Telecom ETF | XTL | 0 | -90 |
| Lyxor Turkey (DJ Turkey Titans 20) UCITS ETF | TUR | 10 | -90 |
| VanEck Vectors/ Junior Gold Miners ETF | GDXJ | 0 | -90 |
| ipath/ Livestock subindex ETN | COW | 0 | -90 |
Top 5 short term rise :
| Short Term | 2 weeks | ||
| ETF | Ticker | Score | variation |
| Lyxor Euro MTS high rated macro weighted govt | MA57 | 0 | 0 |
| Lyxor Smart cash | CSH2 | 20 | 0 |
| Teucrium Sugar Fund | CANE | 20 | 10 |
| AMUNDI ETF GOVT BOND HIGHEST RATED | AM3A | 10 | 10 |
| iPath Bloomberg Cocoa Subindex Total ReturnSM ETN | NIB | 80 | 10 |

Our Krach indicator rose sharply to 51.9 (vs 35.5 the previous week) as markets fell, interest rates rose and volatility rose
This level of indicator leads us to set up a portion of cash in our Asset Allocation (15%)
However, this is only a simple correction of the markets at this stage, as evidenced by the good performance of long-term equity scores (see table).
The rebound of some agricultural commodities was confirmed last week
The Bonds are weakening even though some of them (Senior Loan and Corporate Bonds)
During the entire period during which volatility will remain high, we will publish our Krach indicator on a daily basis.