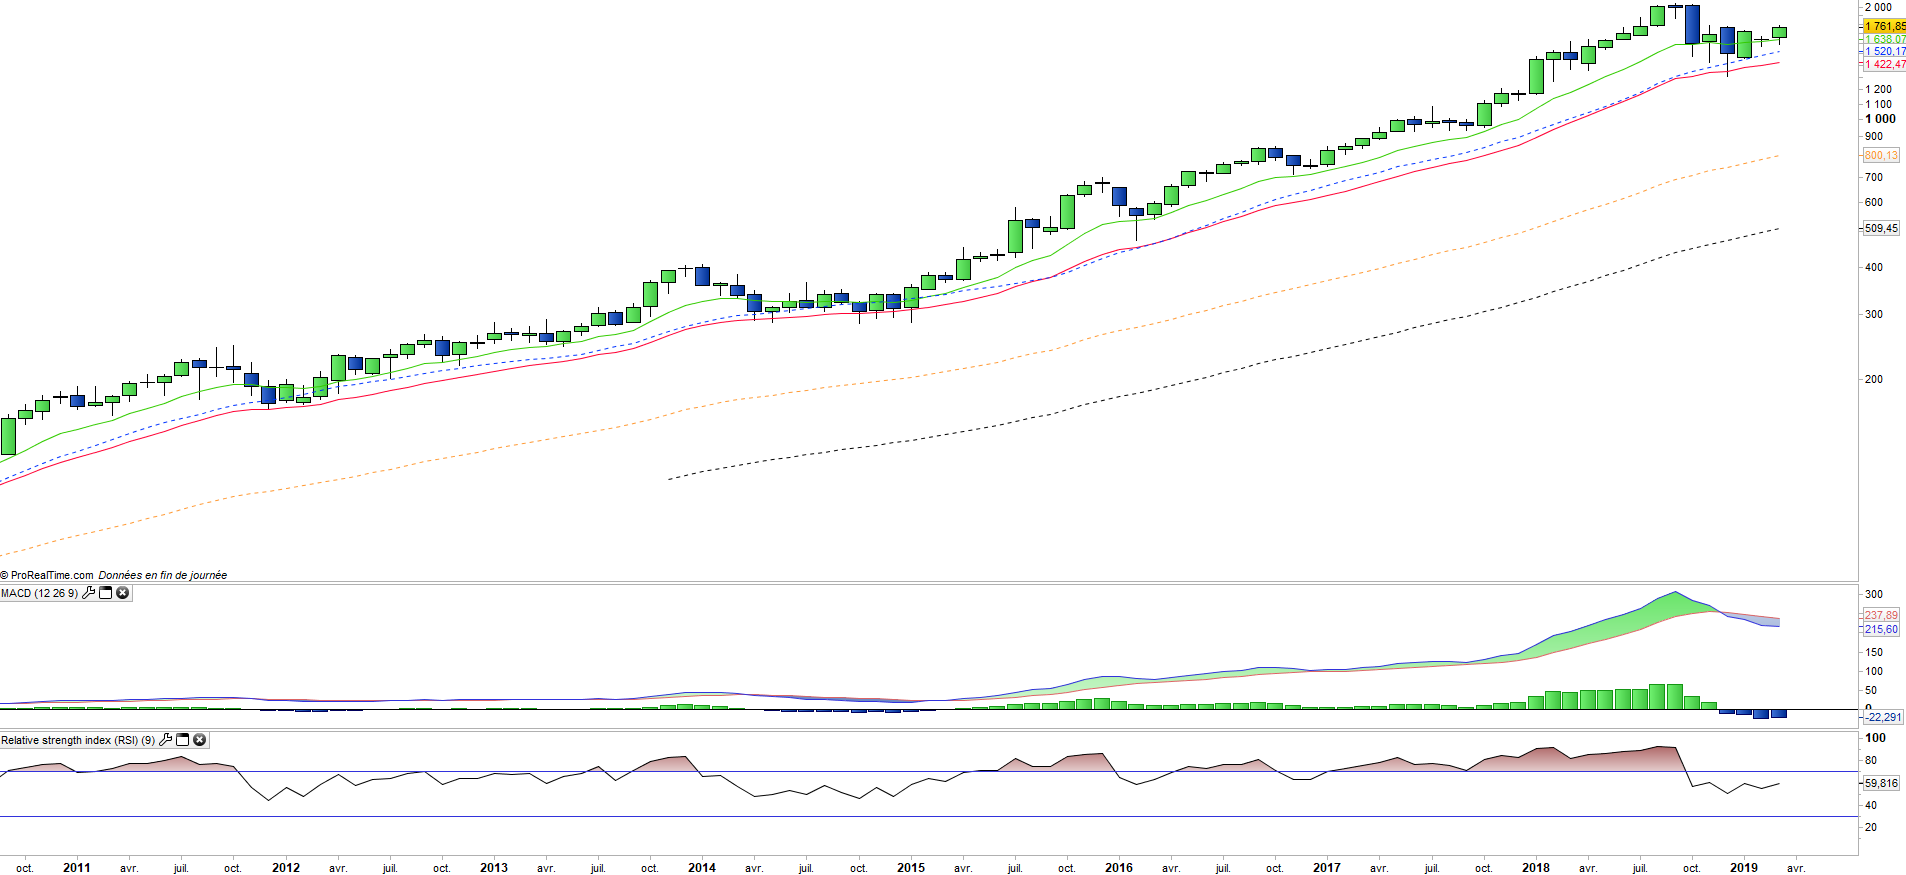
Amazon (AMZN) – Back in grace

AMZN - 19/03/19

Short Term trend: Positive (70/100)

Long Term trend: Positive (60/100)

(scores computed by our proprietary algorithms)

We buy the stock (BUY Alert as of 18/03/19)

to access to our BUY / SELL signals

on Indices, ETFs and Stocks

Company profile

Amazon is the global leader in e-commerce and a Silicon Valley icon, ranking among the top five Nasdaq market capitalizations with Apple, Facebook, Google and Microsoft (GAFAM).

Amazon derives most of its revenues from "cloud" services (technology that allows remote storage of storage data or software that is typically stored on local networked servers within a company to be located remotely) and e-commerce.

The company has an operating margin of about 5%, expanding swiftly and a "cash pile" of over $ 35bn.

AMZN is listed in USD on the Nasdaq.


Revenue 2019 : 275Md$ / Revenue 2020 : 320 Md$

EBIT 2019 : 17.7Md$ / EBIT 2020 : 25.8Md$

NR 2019 :  14 Md$ /NR 2020 : 20.5 Md$

Net cash 2019 :  35 Md$/ Net cash 2020 : 61 Md$

Dividend 2019 : - $  / Dividend 2020 : - $

Market capitalization : 856Md$

PER 2019 : 64 x  /PER 2020 : 45 x

(Estimated datas)


Risks/opportunities

The stock fell at the end of 2018, with a drop of about 35% between October 1st and December 31st, due to a valuation that had become too demanding and worries about global growth as a result of the trade war and the monetary cycle that has since stabilized. The stock has rebounded by 17% since the beginning of the year, with the market downturn and less demanding valuation.

The company is entering a phase where the operating profitability will become a more important focus than revenue growth for investors, while the valuation remains very high at approximately 55x 12 months forward earnings.

Amazon's potential remains considerable.

Technical analysis

Monthly analysis

The graph of monthly datas shows a very strong uptrend despite the sharp correction of 2018, which was halted by the EMA26 level from which a rebound took place. The oscillators remain in the high zone, which confirms a gradual recovery in an uptrend, but the slope of the graph may now be more moderate, like the moving averages that have flattened out in recent months.
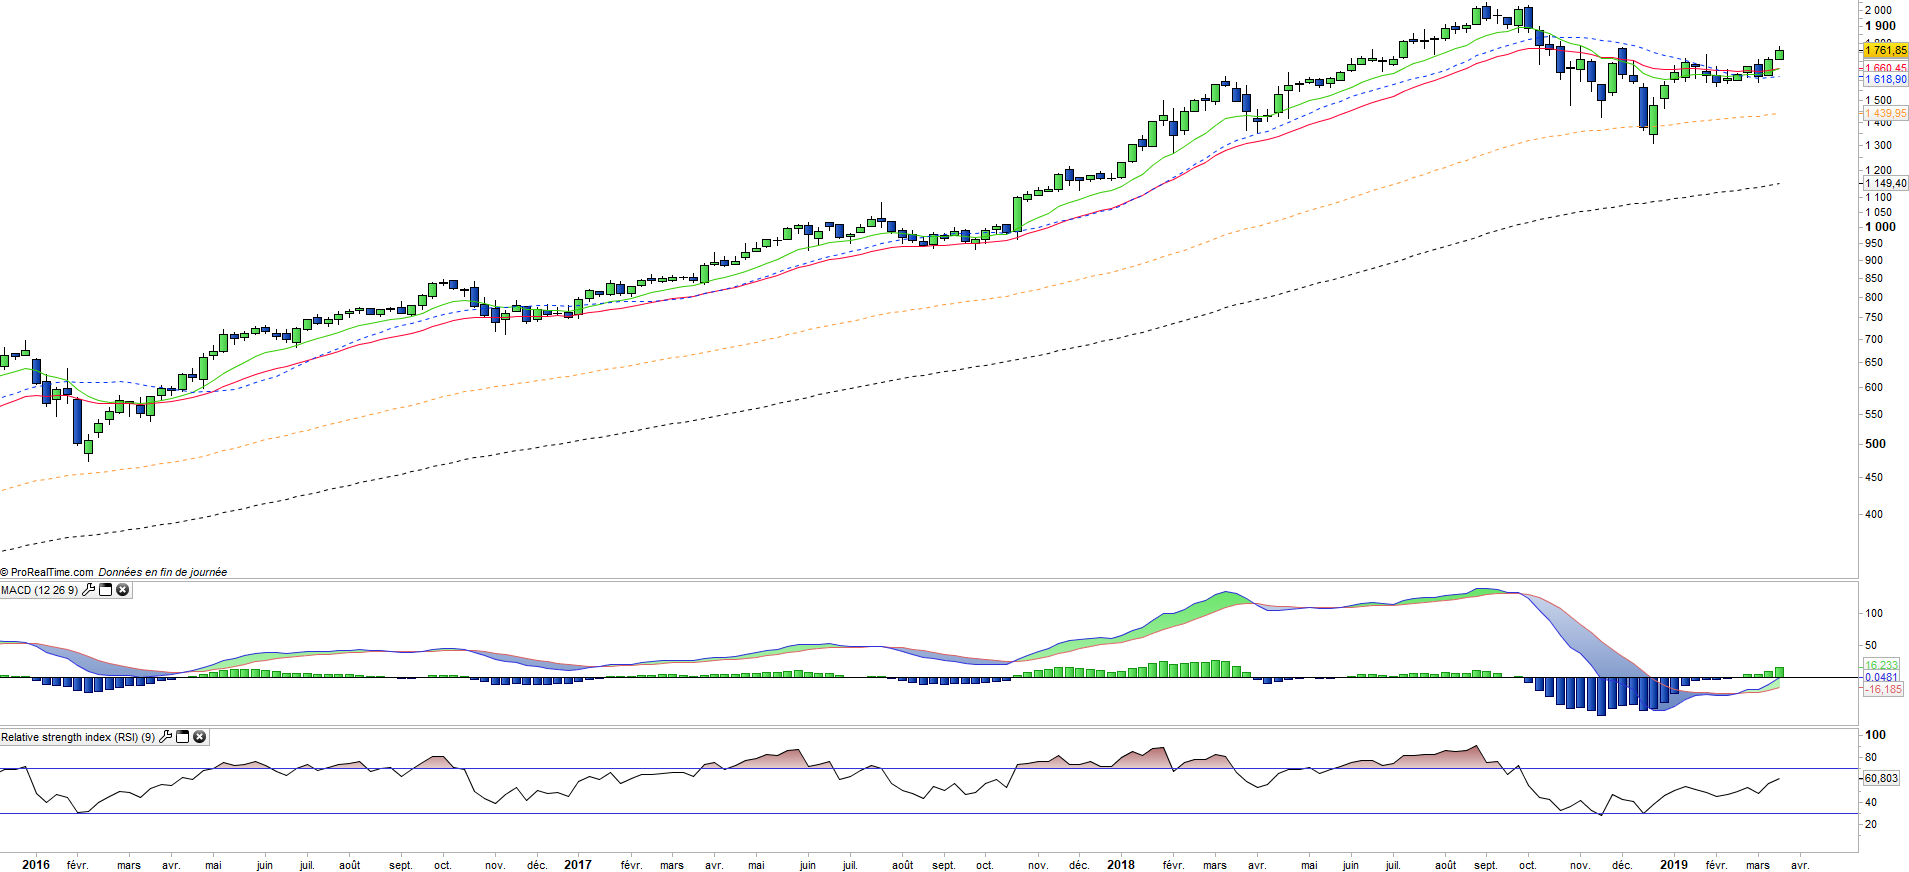
Weekly analysis

The weekly chart shows a rebound in the uptrend, which is reflected by the upward crossing between EMAs13 and 26 and the MACD which is about to cross the zero line. The objective of this figure is to return to the 2018 peak in the coming weeks. However, the moving averages remain fairly flat and a more impulsive recovery is needed to feed the momentum in a medium-term perspective.