AU2 (Lyxor), is an ETF created in 03/2010, which replicates the S & P ASX200 index, which consists of the 200 largest Australian stocks that cover approximately 80% of the country's market capitalization.
The index is weighted by floating capitalization.
The ETF's fees are slightly higher than the average of our sample and stand at 0.4% while the AUM amount to around 70M €. The replication method is indirect (via a swap), the ETF is quoted in Euro and the dividends are distributed.
Alternative ETF : EWA (iShares, $)
Index & components
This index is very deep and covers the bulk of the market capitalization of the country, so it is a very good proxy of the Australian economy.
The first 10 stocks are mainly composed of banks, while financials make up 37% of the index, the other strongly represented compartment is mining / materials for c.18%, which includes the giant BHP Billiton (5,9% of the index).
We see Australia as a growth vehicle, as it is the only country in the OECD that has not experienced a recession during the financial crisis as the economy has experienced 26 consecutive years of growth. Growth reached 2.4% in 2015, despite the fall in coal and iron ore prices, which had a strong impact on exports, and the trend was more or less similar in 2016 (+3%).
This good performance can be explained by the broadening of the economy, following a relative slowdown due to the decline in Chinese demand for exports, particularly of minerals. The mining sector accounts for about 20% of GDP, but investments that have fallen due to falling prices are gradually recovering.
Australia has other assets: a massive export of agricultural products, strong domestic demand and a robust financial sector.
Australia accelerates its integration with the Asia-Pacific region, while the country's main trading partners are Asia (China first), the United States and the European Union. Asia's share of trade with Australia is growing steadily. By 2014, Australia had signed a free trade agreement with China, in line with that agreement, Australia joined the Asian Investment Bank for Infrastructure, created by China in 2015. So investing in the Australian index indirectly focuses on the development of the Asia (and China) zone through an Anglo-Saxon liberal country that is highly financialized but has a lot of natural resources, while population remain limited (approximately 25 million inhabitants). Australia's GDP is around $ 1,300 bn and roughly equal to the level of Spain or Russia, while per capita GDP is one of the highest in the world.
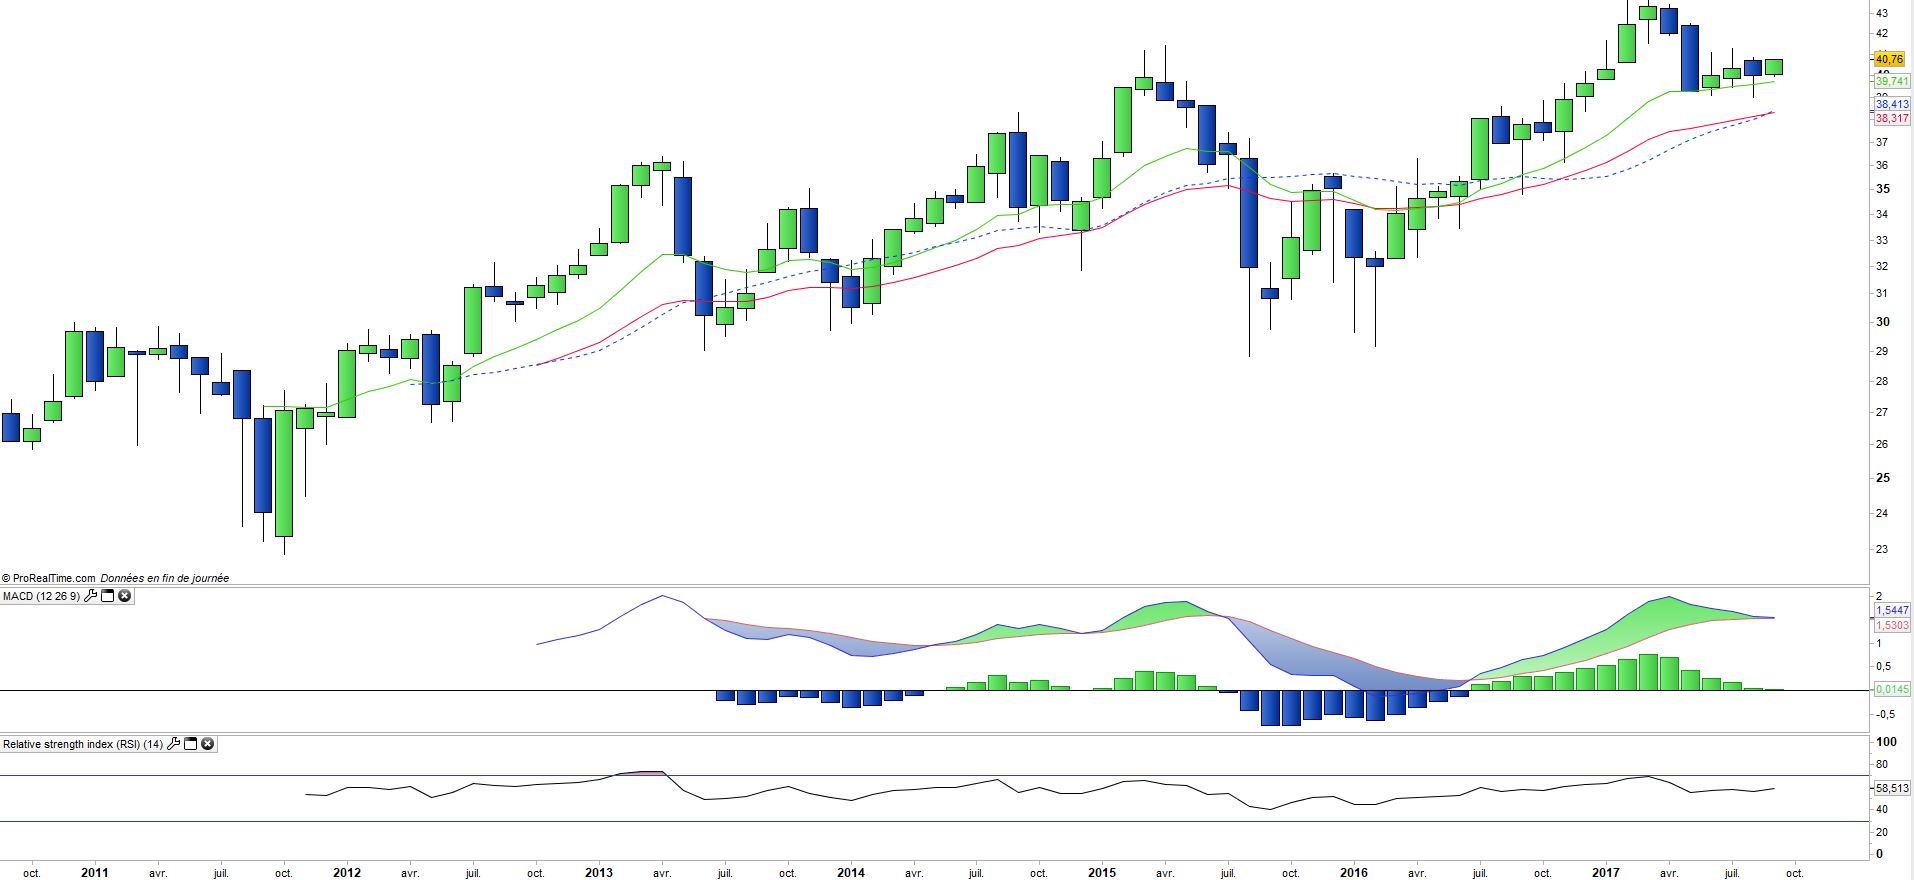
The index is fairly volatile, but is steadily growing and posted + 13% in 2016.
Latest developments
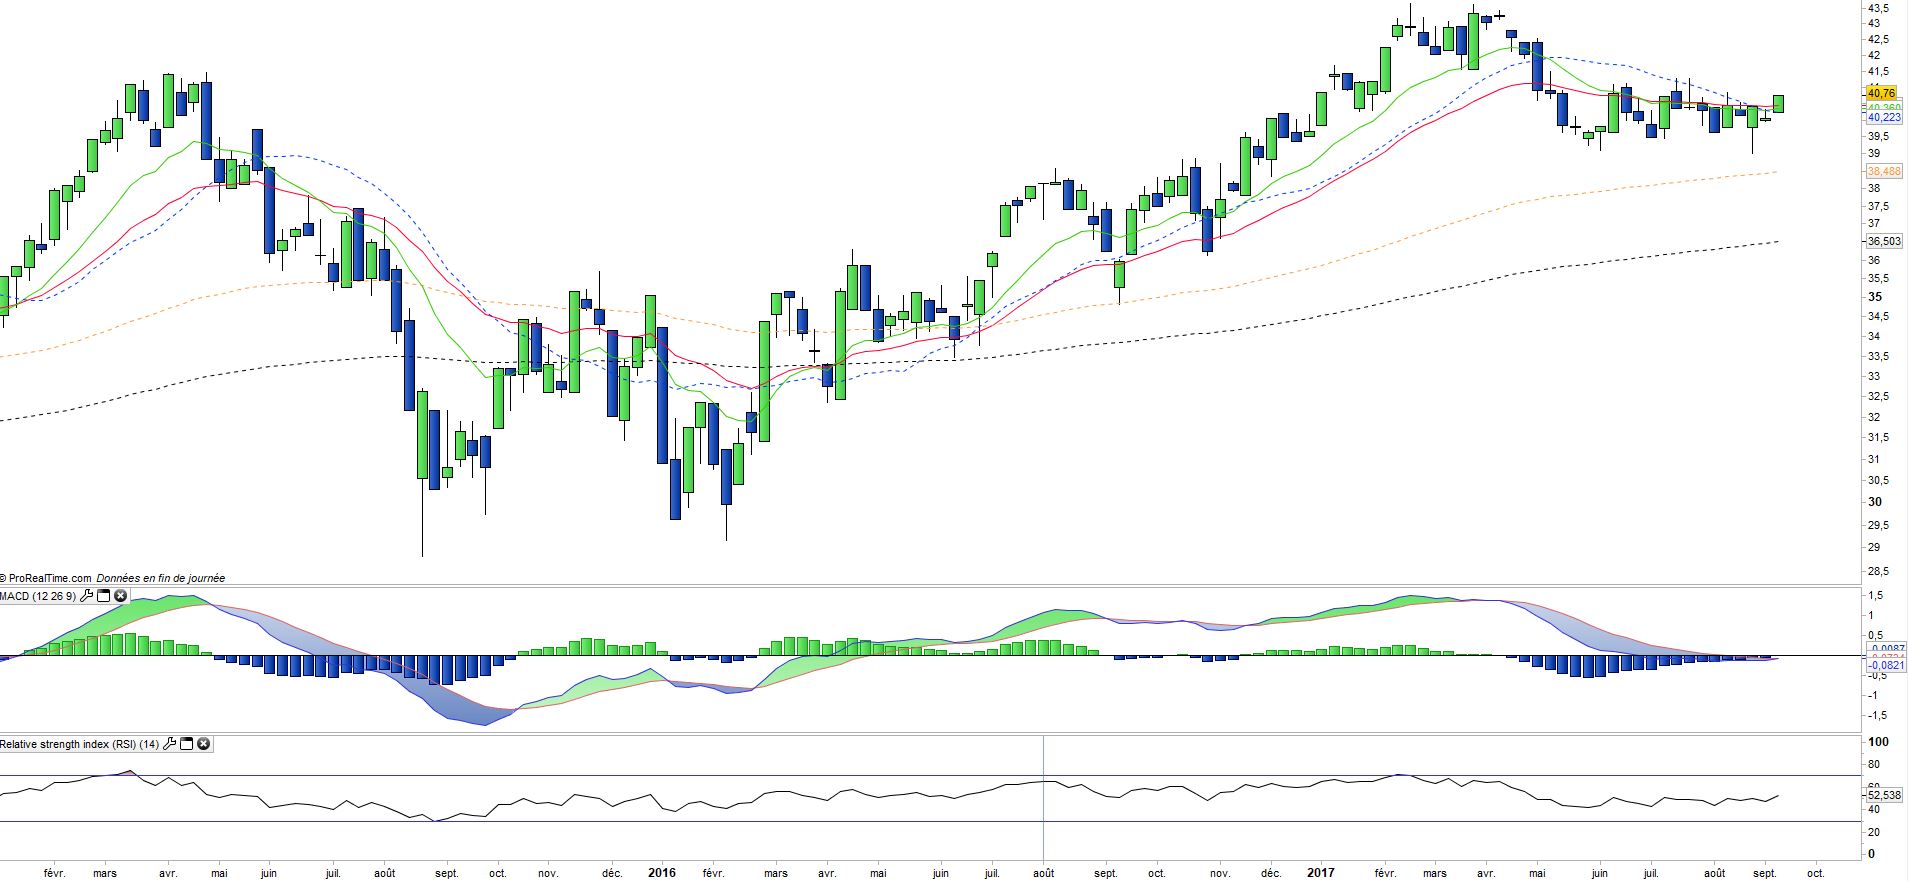
After a strong increase of 13.1% in 2016, the index has only risen by 2.8% since the beginning of the year, partly due to the evolution of the Australian Dollar which has fallen by 8% compared to the Euro, which is explained both by the good prospects of the Eurozone and by the maintenance of a rather accommodative monetary policy by the RBA. In addition, the banking sector weighed negatively on performance (Commonwealth Bank of Australia: -7.9% and Westpak Banking -2.9%). Ian Narev, The chief executive of Commonwealth bank of Australia will resign next year, as the lender struggles with accusations that criminals used its cash machines to launder nearly $35 million.
But the index is now benefiting from the sharp rebound in raw materials that have repercussions on the mining sector (BHP Billinton + 17% since 1 July). The Australian economy grew by 0.8% of GDP in the second quarter, following a 0.3% increase in the first quarter, supported notably by household consumption. However, the central bank has kept rates unchanged at 1.5% and expects growth of 3% in 2018.