Invesco Oil WTI - DBO - 26/11/2018
Short Term strategy: Negative (30%) / Trend -
Long Term strategy: Negative (40%) / Trend -
Characteristics of the ETF
The DBO ETF (Invesco-Powershares) created in 05/2007 replicates the crude oil prices through future contracts on light sweet crude oil (WTI).
The costs of the DBO ETF are 0.75% and AUM amount to approximately $302M. Oil is a very volatile asset, and as any commodity does not give rise to a dividend and is a risky asset.
Alternative ETFs: OLO (Deutsche Bank USD), BNO (US Commodity Fund USD).
Latest developments
WTI oil rose for the second year in a row in 2017 (+ 4.9%) after a rebound of 9.2% in 2016 but is now down by -12% in 2018 after a spectacular fall of -23% in November and -34% since the $ 77 peak in early October.
The first reason for the collapse was the US decision to allow 8 countries to buy oil from Iran (including China, India, Japan, and Turkey), which amounts to removing sanctions on Iran oil export. The other factor is the intense US pressure on Saudi Arabia, exacerbated since the Khashoggi affair, to prevent it from cutting production. As such, the tweets of D. Trump are devastating for the crude prices.
Due to Iran's return to the market, excess production is again very important and the market is doubtful about OPEC's ability to cut production in the context of a major political weakening of Saudi Arabia and its leaders. The OPEC meeting in early December will therefore be key. In the longer term, the production gap remains due to the lack of investment made by the majors since 2014, but in the short term the inflow of Iranian weight on prices.
Index & components
Oil is a Commodity that is a fossil fuel produced by a few countries like Saudi Arabia, the US, Russia, Iran, Iraq, Algeria or Nigeria.
It is extracted by drilling or hydraulic fracturing and is then delivered - processed / refined or not, in consumer countries, mainly European and Asian and can produce fuels such as gasoline, gas oil or kerosene once refined and processed chemically.
Depending on its origin and final destination, oil has different names and its price may also vary. These differences in the price of oil depend on its quality. We differentiate the Arabian Light, which comes from the Middle East, the Brent oil that is produced in the North Sea, and finally the WTI or "West Texas Intermediate" which is produced in the United States and is the benchmark of the oil market.
The reference unit for oil is the barrel, which is actually about 159 liters. The price of a barrel of oil is quoted on the international market continuously, while two financial centers share its rating, namely New York for WTI and London for Brent.
Supply, therefore production and its stability are of course key determinants of the price of a barrel. It is OPEC, made up of several major world producing countries, which is in charge of determining - by consensus - how many barrels a day will be produced and its publications are therefore followed with attention by traders, as was the case recently.
Demand factors are also critical. Thus, an increase in the energy needs of a major consumer country may have a greater or lesser influence on the price of the barrel. Globally, global growth is a very important factor for demand, while oil needs tend to shrink at equal demand, as new technologies tend to reduce consumption.
In the long term, the electric car could cause a negative shock on global demand for crude oil, as China is investing heavily in renewable energy. Since 2014, oil prices have divided by 3 due to a supply shock caused by the arrival on the market of American shale oil which has put very strong pressure on the oil-producing and oil companies that have significantly reduced their investments. This stoppage of industrial investment, in addition to OPEC's production cuts, has for the moment had a moderate bullish impact on crude prices. This is due to the plethoric production of unconventional oil (shale) that floods the market and counterbalances OPEC's reduction efforts.
Monthly data
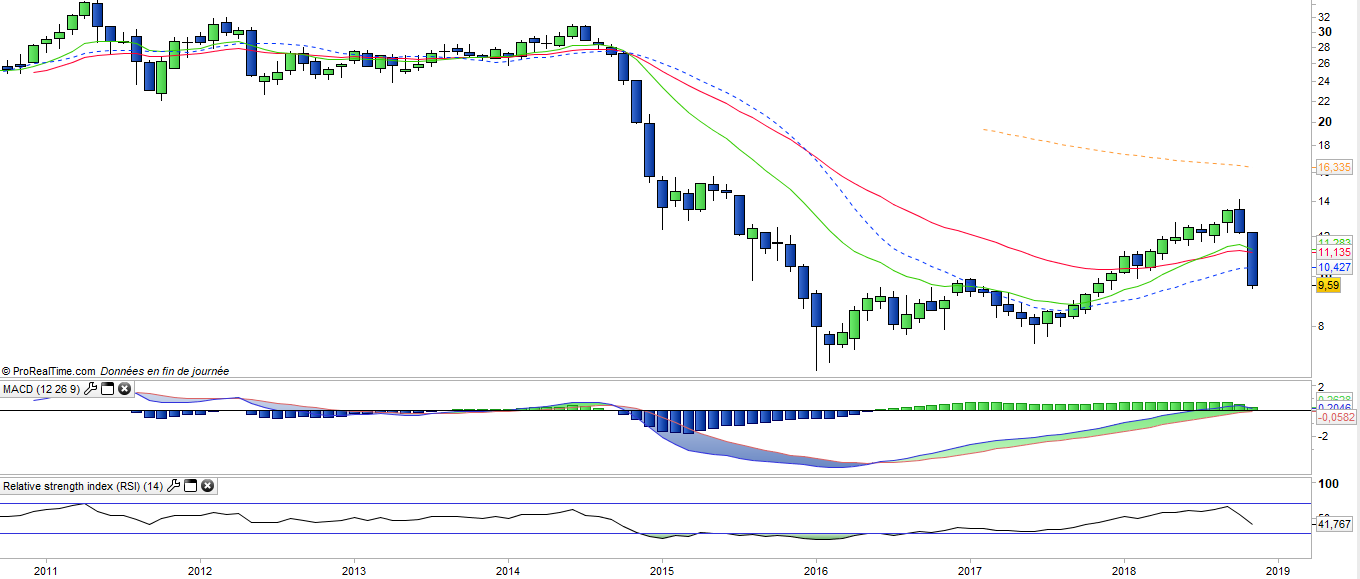
On the monthly chart, we see a fall of a rare brutality that erases almost the entire increase for 2 years. The violence of this reversal did not give time to the delayed oscillators like the MACD to turn around but was however validated by the downward crossing of the EMAs13 & 26. The target for the WTI prices is now a return to 2016 lows at around $ 40.
Weekly data
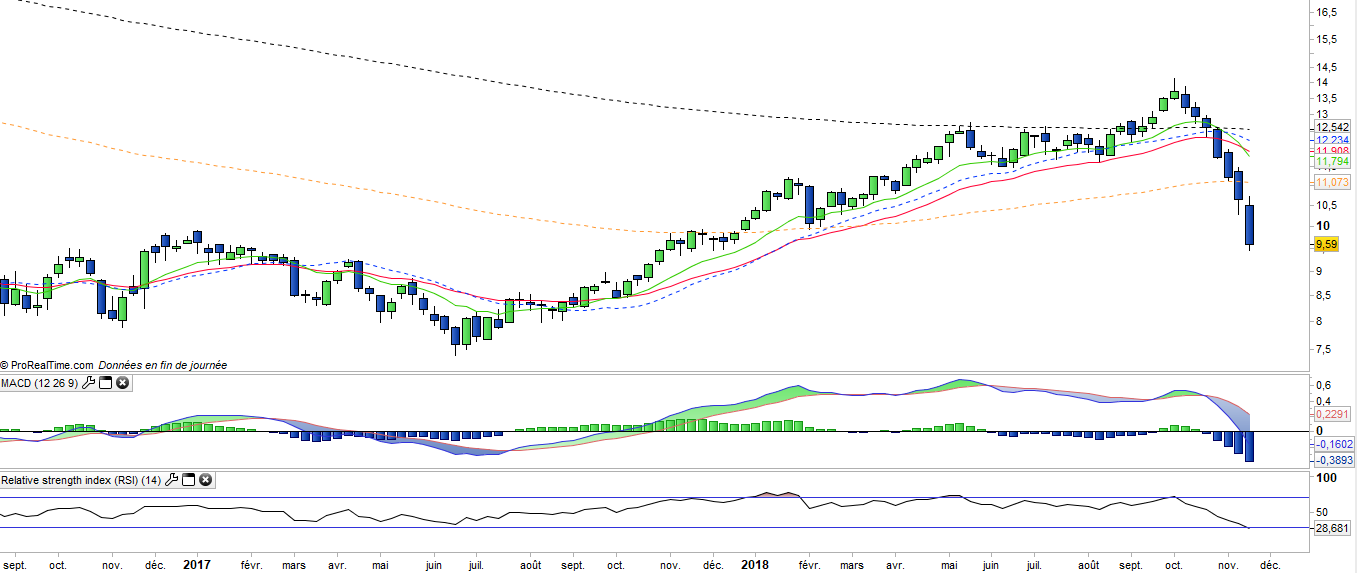
The weekly chart shows a real Crash on crude prices, with weekly candles getting bigger and bigger, showing a bearish panic and probably an exaggeration. However there is still $ 10 to lose (20%) before joining the major support which could take the form of a capitulation in the form of Crash, before stabilization.
ETF Objective
DBO is an ETF, listed in USD, which seeks to replicate the level of the DBIQ Optimum Yield Crude Oil Index Excess Return
Characteristics
| Inception date | 01/05/2007 |
| Expense ratio | 0,78% |
| Issuer | Invesco |
| Benchmark | DBIQ Optimum Yield Crude Oil Index Excess Return |
| code/ticker | DBO |
| ISIN | US73936B5075 |
| Currency | $ |
| Exchange | NYSE |
| Assets Under Management | 302 M$ |
| Dividend | No |
| Currency Risk | No |
| Number of Holdings | NS |
| Risk | 4/5 |
Country Breakdown
| USA | 100% |
Sector Breakdown
| Oil WTI | 100% |
Top Ten Holdings
| Oil WTI | 100% |