The DBO ETB (Invesco-Powershares) replicates the WTI oil prices.
The costs of the BOD ETF amount to 0.78% which is in the high average fees on this type of product. Assets Under Management : 404 M$.
Oil is a very volatile asset, which does not pay dividends and is a risky asset. Oil is a commodity that is a fossil energy produced by some countries like Saudi Arabia, USA, Russia, Iran, Iraq, Algeria or Nigeria. It is extracted by drilling and is then delivered -transformed / refined or not, in consumer countries, mainly European and Asian and allows to produce fuels such as gasoline, gas oil or kerosene once refined and chemically treated. Depending on its origin and final destination, oil carries different names and its price may also vary. These observed differences in the price of oil depend on its quality. The Arabian Light, which comes from the Middle East, is distinguished by Brent oil produced in the North Sea and WTI or West Texas Intermediate, which is produced in the United States and is the reference quotation of the oil market.
The unit of reference used for oil is the barrel which actually corresponds to about 159 liters. The price of a barrel of oil is quoted on the international market continuously, while two financial places share its quotation, namely New York for the WTI and London for the Brent. Supply, and therefore production and its stability, is of course a determining factor in the price of a barrel.
It is OPEC, made up of several major world producer countries, which is in charge of determining - by consensus - how many barrels will be produced per day and its publications are therefore followed closely by traders, as was the case recently. Demand-side factors are also paramount. Thus, an increase in the energy needs of a large consumer country may have a greater or lesser influence on the price of a barrel. Globally, global growth is a very important factor in demand, while oil demand decrease structurally as new technologies tend to reduce consumption. In the long term, the electric car could lead to a negative shock on world crude demand, as is China, which invests heavily in renewable energies.
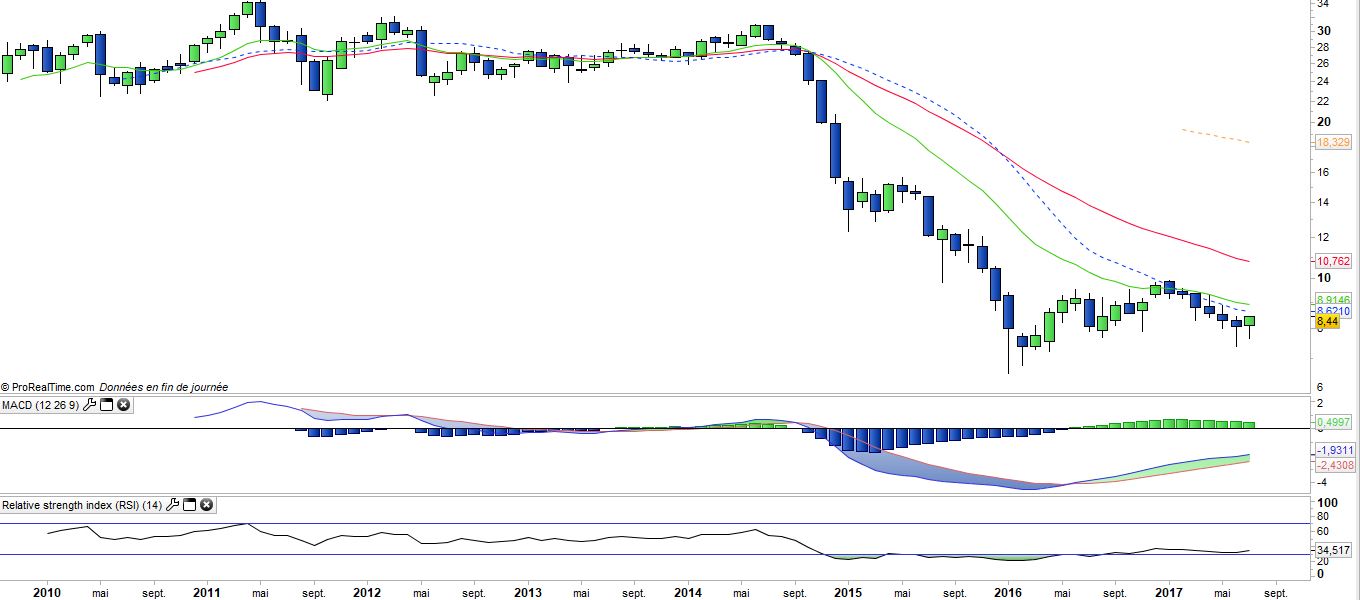
Since 2014, oil prices have been cut by a factor of three due to a supply shock caused by the arrival of US shale oil, which exerted considerable pressure on oil-producing countries and large Oil companies that have severely reduced their investment. This stoppage in industrial investment, coupled with OPEC production cuts, has for the moment had a very modest upward impact on crude oil prices. At issue is the over-production and supply of unconventional oil (shale) that floods the market and counteracts OPEC's reduction efforts. The agreement on OPEC reduction cuts was renewed (but not deepened) until March 2018, and is beginning to crack, because of no impact on prices. The Russians could lose patience and focus on their market share.
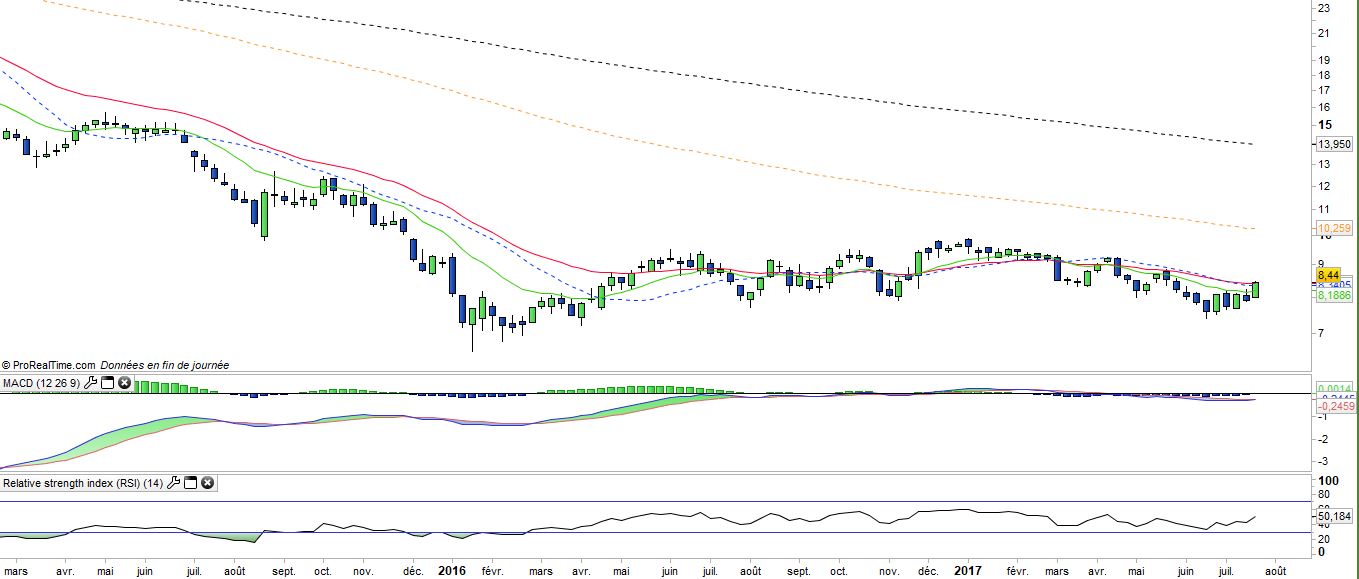
Short-term trends (shale oil) and long-term trends (batteries, renewables, technology) are negative. A collapse in crude oil prices is not excluded in the medium term, as no natural support appears to be emerging on the horizon. However, the looming fall in Venezuela, coupled with the fall in the dollar, which is boosting demand from Europe and Asia, is a short-term support factor for oil. In addition, OPEC is said to be in the process of negotiating additional production cuts. In the end the shale oil could face a bottleneck link to infrastructures limits that would likely curb the growth of its production for some time.