SPDR ETF Dow Jones - DIA - 24/07/2017
Short term strategy : Positive (60%) / Trend =
Long term strategy : Positive (95%) / Trend =
Characteristics of the ETF
The ETF DIA (SPDR) replicates the Dow Jones Industrial Average, which is composed of the 30 largest US companies selected according to the size of their market capitalisation.
Integrating the Dow Jones is regarded as a consecration, as long as one has to be very established to achieve it, so it sits only the emblematic companies of America like IBM, Coca Colas, Boeing or Goldman Sachs. The interest of this index is primarily the quality and robustness of its components while the average capitalisation is 200 bn $, with a balanced sectoral wheighting whose 3 main sectors are industrials (21%%) with major names such as 3 M, Dupont de Nemours or Boeing, financials (17%) with major US banks, the technology sector (17%) including the most established stocks such as IBM, Apple and Microsoft.
The DJIA is a much narrower than the S & P500 and may prove more volatile, for example when financial are under pressure. The multiples of the Dow Jones are currently around 17x forward EPS, which is rather in the middle high of the range (historically between 15 and 20x), but must be relativized by the fall in bank profits and especially of energy-related stocks in 2016 and must also be viewed in light with economic growth of more than 2% in a context of low interest rates.
The ETF DIA is currently the benchmark tracker to replicate the US flagship with fees limited to 0.17%.
The index has consistently posted a few weeks of historical highs, after crossing the emblematic threshold of 20000 pts upwards, it is now heading towards 22000 pts. The index benefited from the election of Donald Trump and its promises of massive infrastructure program, and announced deregulation on banks that also benefits this sector. The new round of rate hikes will be, according to the latest FED statements, very gradual and should not pose a threat to US growth in the coming months as the dollar is falling against the Euro and other currencies, which should benefit US companies, especially as corporate margins looks close to the top of the cycle.
The very low volatility as well as the upward trend of the index that has lasted 8 years so far, seem to indicate that the situation of low rate / moderate growth can still persist for some time.
Monthly data
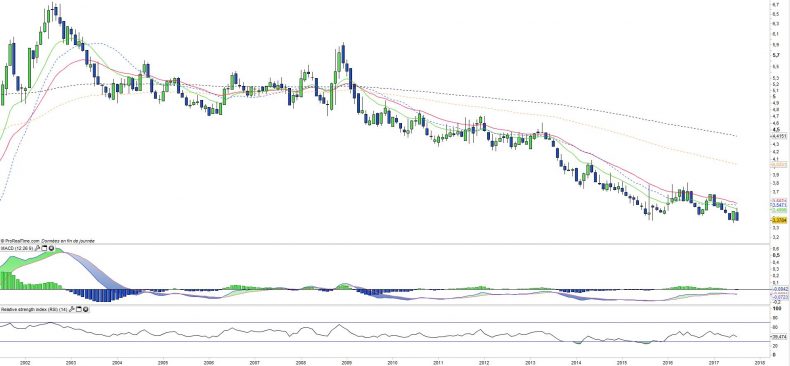
While the analysis of monthly absolute charts shows a very bullish and steady trend, it seems more interesting to watch the spread DJ30 / Nasdaq Composite. It is clear that the index of large values underperforms technological values over time. In 2017 the rise of the Nasdaq is about twice that of the DJ30 (18.6% against 9.2%).
Despite rebounds, as at the end of 2016 in the wake of the Donald Trump election, this trend is very established and does not seem ready to stop.
Weekly data
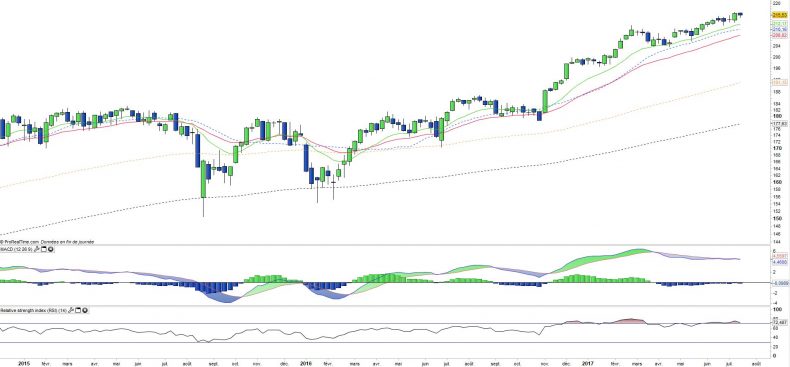
Analysis of the weekly charts (in absolute terms this time) of the Dow Jones 30, shows a very steady upward trend, and phases of relative weakness have not been utilized by sellers. The MACD turned bearish during the consolidation in March, but now seems to flatten and ready to turn again.
Moving averages are rising and low volatility makes it unlikely that a change of direction will occur in the short term.
ETF Objective
The SPDR Dow Jones Industrial Average is an ETF which seeks the performance of the Dow Jones Industrial Average (DJIA)
The DJIA is composed of 30 "blue-chip" U.S. stocks
Characteristics
| Inception date | 14/01/1998 |
| Expenses | 0,17% |
| Issuer | SPDR |
| Benchmark | Dow Jones Industrial Average |
| Code/Ticker | DIA |
| CUSIP | 78467X109 |
| EU-SD status | Yes |
| Currency | $ |
| Exchange | NYSE Arca |
| Assets Under Management | 16 660 M$ |
| Dividend | distribution |
| Currency Risk | No |
| Number of Holdings | 30 |
| Risk | 3/5 |
Country Breakdown
| USA | 100% |
Sector Breakdown
| Industrials | 22% |
| Information Technology | 17% |
| Financials | 17% |
| Consumer Discretionary | 15% |
| Health Care | 13% |
| Consumer Staples | 7% |
| Energy | 6% |
| Materials | 3% |
| Telecommunication Services | 1% |
Top ten Holdings
| Goldman Sachs | 7% |
| 3M Company | 7% |
| Boeing | 7% |
| UnitedHealth Group | 6% |
| IBM Corp. | 5% |
| Home Depot | 5% |
| Apple | 5% |
| Mc Donald's | 4% |
| Johnson & Johnson | 4% |
| Travelers Companies | 4% |


