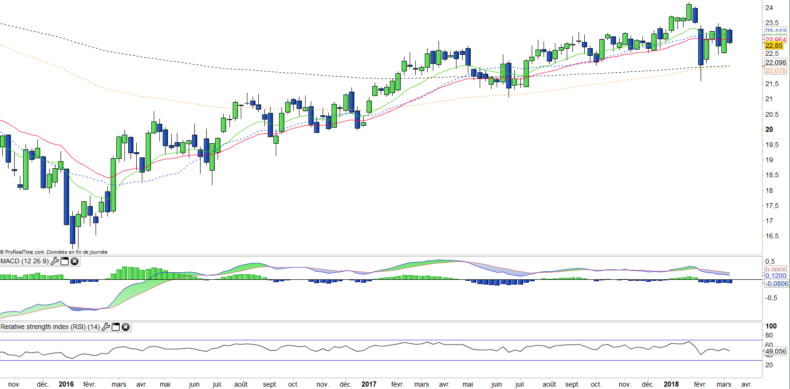
iShares MSCI Australia (EWA) - 16/03/2018
Short Term strategy: Negative (30%) / Trend -
Long Term strategy: Positive (90%) / Trend =
Characteristics of the ETF
The EWA ETF (iShares) created in 03/1996 replicates the MSCI Australia Index composed of the 69 main Australian stocks including 40% of financial stocks and 17% of mining stocks.
ETF fees are 0.49% while AUM are approximately $ 1633M. The replication method is direct (physical), the ETF quotes in USD on the Nyse and the dividend payout policy is by semi-annual distribution.
Alternative ETFs: AU2 (Lyxor in Euro)
Latest developments
After a sharp increase of 14.5% in 2017, the index has fallen -1.4% since the beginning of the year, which is due to the correction coming from the USA in February slightly mitigated by a 1% increase in the Australian dollar against the US dollar.
Since the summer of 2017, the index has benefited from the good performance of raw materials, which has had repercussions on the mining sector (BHP Billinton + 18% in 2017), but profit-taking took place at the beginning of the year.
In terms of international trade, a strong complementarity has been established between a growing Asia and an Australia rich in mineral reserves (coal, uranium, iron, gold, lignite, nickel, lead, copper), energy (gas) and agricultural products (meat, cereals, cotton, wool). Australian exports to the area are steadily increasing, especially to China (+ 25% per annum), Australia's leading bilateral trading partner. The Asia-Pacific region thus absorbs 71% of Australian exports (11.5% to the EU, 9% of the United States) and supplies 52% of imports (against 24% from the EU and 14% the United States).
Index & components
This index is very deep and covers the bulk of the market capitalization of the country, so it is a very good proxy of the Australian economy.
The first 10 stocks are mainly composed of banks, while financials make up 40% of the index, the other strongly represented compartment is mining / materials for c.17%, which includes the giant BHP Billiton (7% of the index) and Rio Tinto (2.3%).
We see Australia as a growth vehicle, as it is the only country in the OECD that has not experienced a recession during the financial crisis as the economy has experienced 26 consecutive years of growth. Growth reached 2.4% in 2015, despite the fall in coal and iron ore prices, which had a strong impact on exports, and the trend was more or less similar in 2016 (+ 3%) and in 2017 (+2.4%). This good performance can be explained by the broadening of the economy, following a relative slowdown due to the decline in Chinese demand for exports, particularly of minerals.
The mining sector accounts for about 20% of GDP, but investments that have fallen due to falling prices are gradually recovering. Australia has other assets: a massive export of agricultural products, strong domestic demand and a robust financial sector. Australia accelerates its integration with the Asia-Pacific region, while the country's main trading partners are Asia (China first), the United States and the European Union. Asia's share of trade with Australia is growing steadily. By 2014, Australia had signed a free trade agreement with China, in line with that agreement, Australia joined the Asian Investment Bank for Infrastructure, created by China in 2015.
So investing in the Australian index indirectly focuses on the development of the Asia (and China) zone through an Anglo-Saxon liberal country that is highly financialized but has a lot of natural resources, while population remain limited (approximately 25 million inhabitants). Australia's GDP is around $ 1,300 bn and roughly equal to the level of Spain or Russia, while per capita GDP is one of the highest in the world.
Monthly data
The monthly chart shows a long-term trend that remains positive, despite a slowdown in the uptrend following the US start-of-year correction. However prices remain well above the main moving averages and the MACD remains well oriented. After some disruption, the underlying trend should pick up again. The next goal is in the $ 27 / $ 28 zone.
Weekly data
On the weekly chart, there is a pause since February which causes the flattening of the weekly moving averages EMA13 and EMA26. The trend remains favorable as long as the EMA100 is not broken out and in the absence of downward crossings of EMA13 and 26. The indicators marked a consolidation without being really downward. The medium-term trend is not threatened at the moment.
ETF Objective
EWA is an ETF listed in USD which seeks to replicate the MSCI Australia index (69 australian companies)
Characteristics
| Inception date | 12/03/1996 |
| Expense ratio | 0,48% |
| Benchmark | MSCI Canada Index |
| Issuer | iShares |
| Ticker | EWA |
| ISIN | US4642861037 |
| Currency | $ |
| Exchange | NYSE |
| Assets Under Management | 1 617 M$ |
| Dividend | Distribution |
| Currency Risk | No |
| Number of holdings | 69 |
| Risk | 3/5 |
Country Breakdown
| Australia | 100% |
Sector breakdown
| Financials | 41% |
| Materials | 17% |
| Health Care | 8% |
| Real Estate | 8% |
| Consumer Staples | 7% |
| Energy | 5% |
| Industrials | 5% |
| Others | 9% |
Top Ten Holdings
| COMMONWEALTH BANK OF AUSTRALIA | 10% |
| WESTPAC BANKING CORPORATION CORP | 8% |
| BHP BILLITON LTD | 7% |
| AUSTRALIA AND NEW ZEALAND BANKING | 6% |
| NATIONAL AUSTRALIA BANK LTD | 6% |
| CSL LTD | 6% |
| WESFARMERS LTD | 4% |
| WOOLWORTHS GROUP LTD | 3% |
| MACQUARIE GROUP LTD DEF | 3% |
| RIO TINTO LTD | 2% |


