The FDN (First Trust) ETF created in 06/2006 replicates the Dow Jones Internet Index, which is composed of the main US stocks in the sector. This index is fairly broad and includes 41 holdings that must necessarily generate at least 50% of their turnover via the internet, have a minimum market capitalization of $ 100M over the last 3 months of listing, have a stock price of at least $ 10 and meet liquidity requirements.
This ETF is listed as its components in USD and incurs a fee of 0.53% with an AUM of about $ 7591M. The replication method is direct and there is so far no dividend distribution.
Alternative ETFs: PNQI, pxq, xweb
Index & components
The FDN (First Trust) ETF allows investors to access a basket of 41 US Internet stocks with a market capitalization of between $ 1263m and $ 977bn.
The first 10 stocks (including Facebook 8%, Amazon 9.3% and Alphabet 10%) account for more than half of the index's capitalization, ie 52,2%.
This index is fairly diversified from an industry perspective, including e-commerce players, Internet services, IT services / software but also financials, telecom companies and even health players. These are growth sectors which reshape existing industries through digitization and a dual expertise shared between the customer interface (digital) and business expertise (eg logistics for e-commerce, media for Internet services, cloud technology) and a certain marketing skill. The success of these companies is also explained by the possibility of addressing a global market in an immediate way, with a sales process shortened to the maximum and without having to incur the costs and risks of a significant physical presence on the markets addressed.
Despite the large market capitalizations of the major players, there is still a great potential as both the corporates digitizing and e-commerce are accelerating in the developed countries, and are still in the beginning in most emerging countries. However, large competitors are emerging in some major emerging countries (such as Alibaba and Baidu in China), which is expected to strengthen in the years to come, particularly in China, India and Russia.
On the other hand, governments are beginning to organize themselves in relation to the major Internet players who historically pay virtually no taxes outside the United States, and a turnover tax is being studied in Europe.
The margins of the major players could therefore be somewhat reduced under the pressure of new taxes and competition in the coming years. While the 10 major stocks in the index represent a true pole of stability, the other 31 stocks have strong potential and are likely to raise the index over the next few years with the emergence of new leaders.
Latest developments
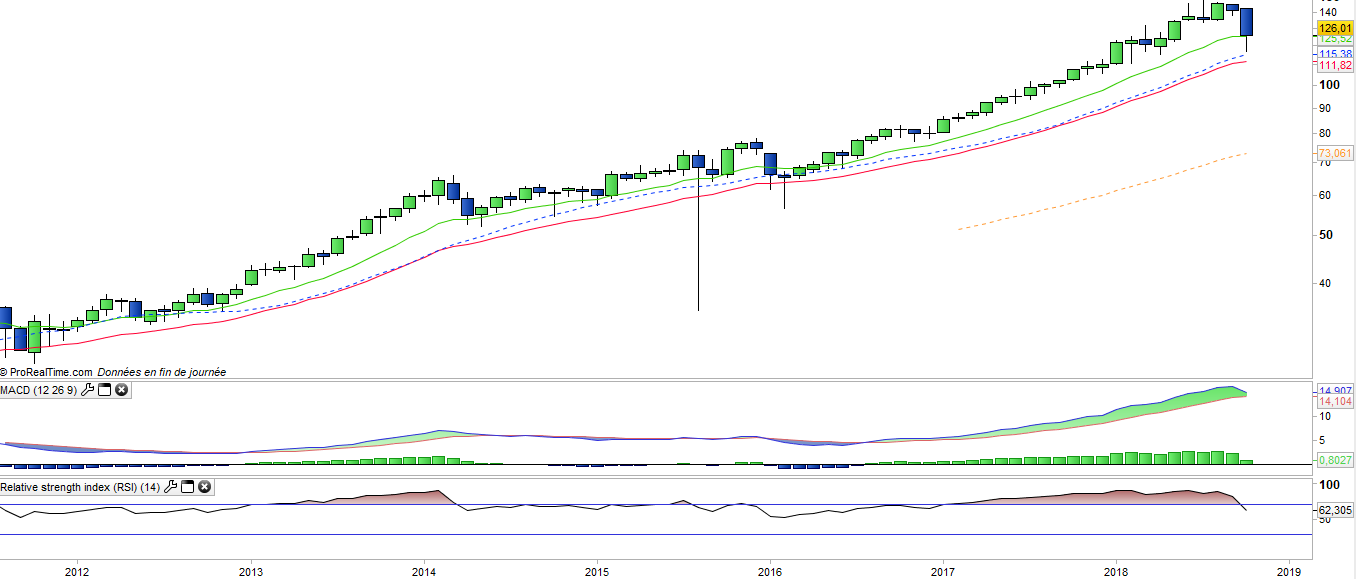
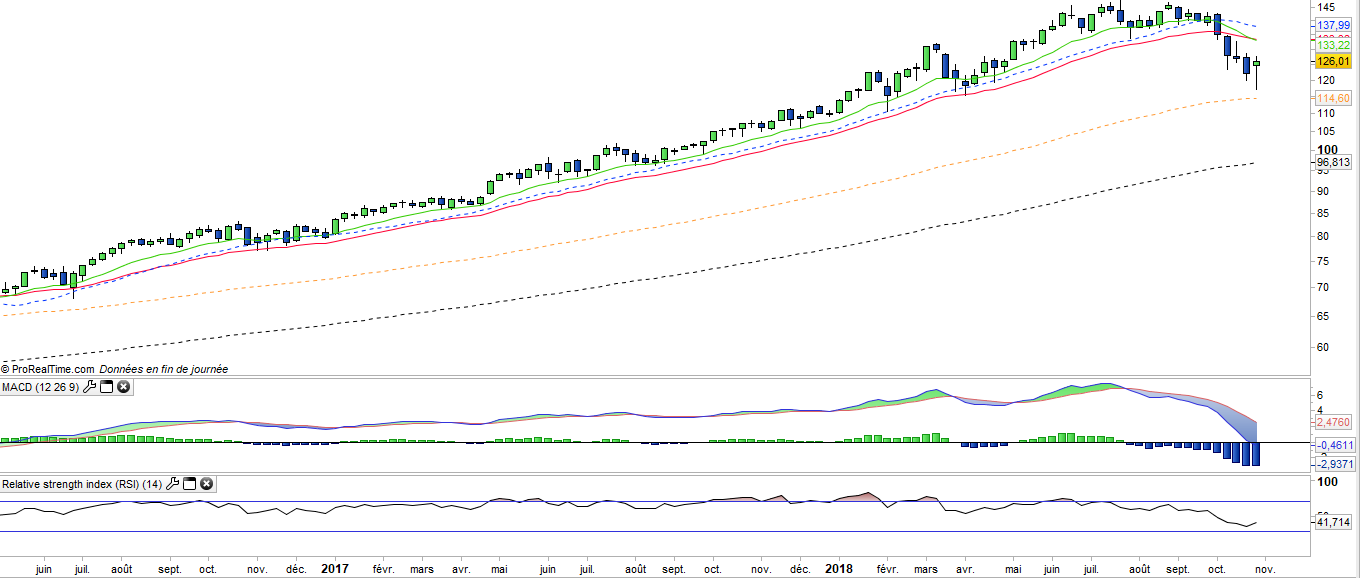
FDN has been growing steadily since 2012, and after rising by 37.7% in 2017, has posted a +8.8% increase since the end of the year, despite the strong correction in progress, which particularly affects Facebook and Amazon.
This current correction is mainly related to the macro-economic context (US long-term rates, tensions with China, the rise in Fed rates) as well as overly generous valuations despite double-digit earnings growth rates estimated in 2018 and 2019.
Small caps in the index undergo an even more pronounced correction, such as Arista Networks, 2U inc or Hubspot, which are on average 30% below their highest.
A problem and threat to the giants of the net is currently posed by governments with US antitrust that could potentially threaten Amazon integrity while a European tax on turnover achieved by companies in the sector is currently discussed. After several disappointments, the Facebook Q3 results above expectations should cause a rebound in the index.