iShares China large cap ETF (FXI) - 14/05/2018
Short Term strategy : Positive (90%) / Trend +
Long Term strategy: Positive (95%) / Trend =
Characteristics of the ETF
The FXI ETF (iShares) created in 10/2004 is listed in US dollar on the NYSE and replicates the FTSE China 50 Index which is composed of the main Chinese stocks listed in Hong Kong and composed for more than half of the capitalization of financial values. These shares are subject to the Chinese regulation but denominated in Hong Kong dollar (HKD). Chinese H shares, unlike A shares, are available to non-resident investors in China.
The fees of this ETF are 0.74% for AUM of $ 4578M. The replication method is physical and there is a semi-annual dividend distribution policy.
Alternative ETFs: CSIA (Lyxor in Euro), CC1 (Lyxor in Euro)
Latest developments
After a 33% increase in 2017, FXI posted a further increase of 4.3% in 2018 despite the sharp correction in February from the United States.
After very good economic data on the end of 2017, which has been confirmed by the corporate results, China is now at the heart of trade negotiations with the Trump administration on trade, after spectacular announcements of tariff increases and a proposal of opening of the Chinese president on his automobile sector. The US-China negotiations are an issue for the global economy that would suffer a great deal from a trade war, however they will take some time to achieve concrete results. Some positive announcements could happen just before the US mid-term elections, a concession that China could make to coax its interlocutor, while the heart of the negotiations could take months and will not necessarily turn to the advantage of the US.
Index & components
The equities that make up the FTSE China 50 Index come from the universe of the most important stocks in the Chinese market.
The FTSE China 50 Index is composed of 50 constituents, so it is relatively diversified. The financial sector (banks and insurance companies), however, accounts for about 48% of the capitalization while the China Construction Bank accounts for 9% of the index.
China is the world's second largest economy behind the US with a GDP of about $ 13600bn in 2017, the world's largest exporter with the world's largest foreign exchange reserves.
The global recession of 2009 interrupted China's continued growth momentum, and the limits of its export-oriented growth model emerged. As a result of the global economic downturn and declining trade, Chinese growth decelerated to below 7% in 2015, its lowest level in 25 years. However, in 2017, growth reached 6.9% of GDP, an improvement over 2016 (6.7%). State-owned enterprise debt accounts for 145% of GDP while private sector debt accounts for more than 200% of GDP. In addition, the quality of bank assets has deteriorated for several years and this trend is probably underestimated because of the importance of shadow banking.
Many challenges remain linked to the problem of an aging population, the lack of openness of the political system, the competitiveness of an economy dependent on high investment expenditure and the expansion of credit. The manufacturing and construction sectors contribute nearly half of China's GDP, but the country is increasingly relying on services and domestic consumption.
China has set a new growth target for 2018 of around 6.5%, which means a gradual soft landing linked to the new growth model, more based on quality, corresponding to an upscaling of industry and services, but also focused on reducing the current major imbalances (too high debt, overcapacity in industry and real estate). China no longer seems to be in the race for growth, but in search of a more balanced and sustainable model based on the upscaling of its industry through technology and the expansion of services and domestic consumption. China faces geopolitical problems with most of its neighbors (India, Japan ...) and especially in the China Sea, because of its plans for territorial expansion that could lead to military confrontations. Its confrontation with the USA, at the commercial level, could be amplified after D.Trump protectionnist actions.
Weekly data
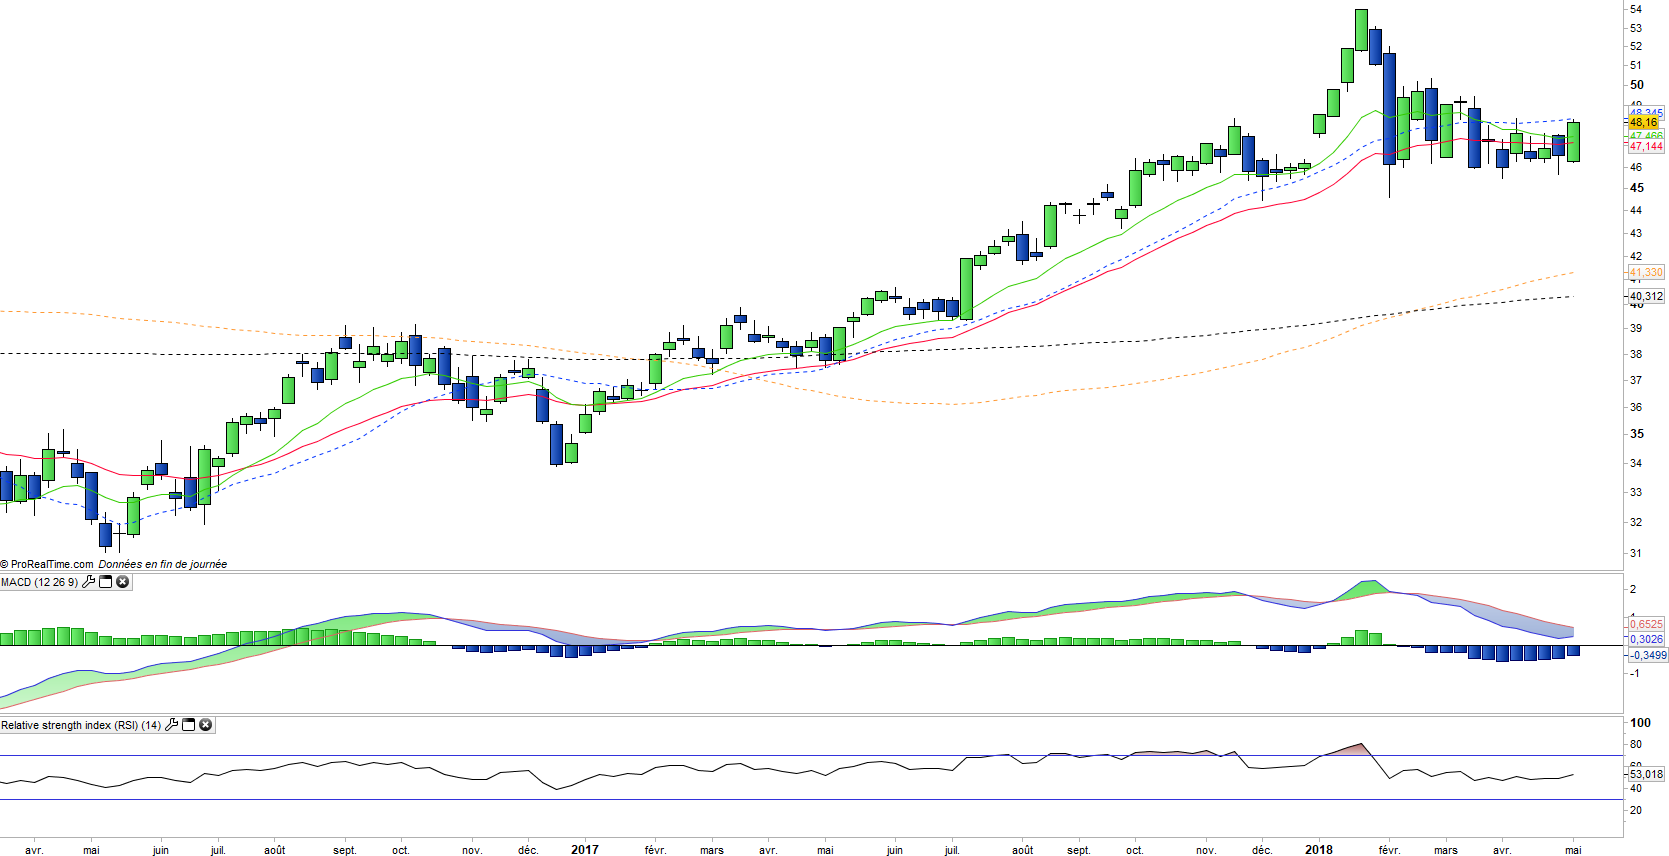
The weekly chart analysis shows a bullish figure in the form of bullish engulfing which argues for a continuation of upward movement. The prices stopped just at the level of the EMA20 which is the next obstacle. The increase is to be confirmed this week, which would allow the technical indicators to turn upwards.
Daily data
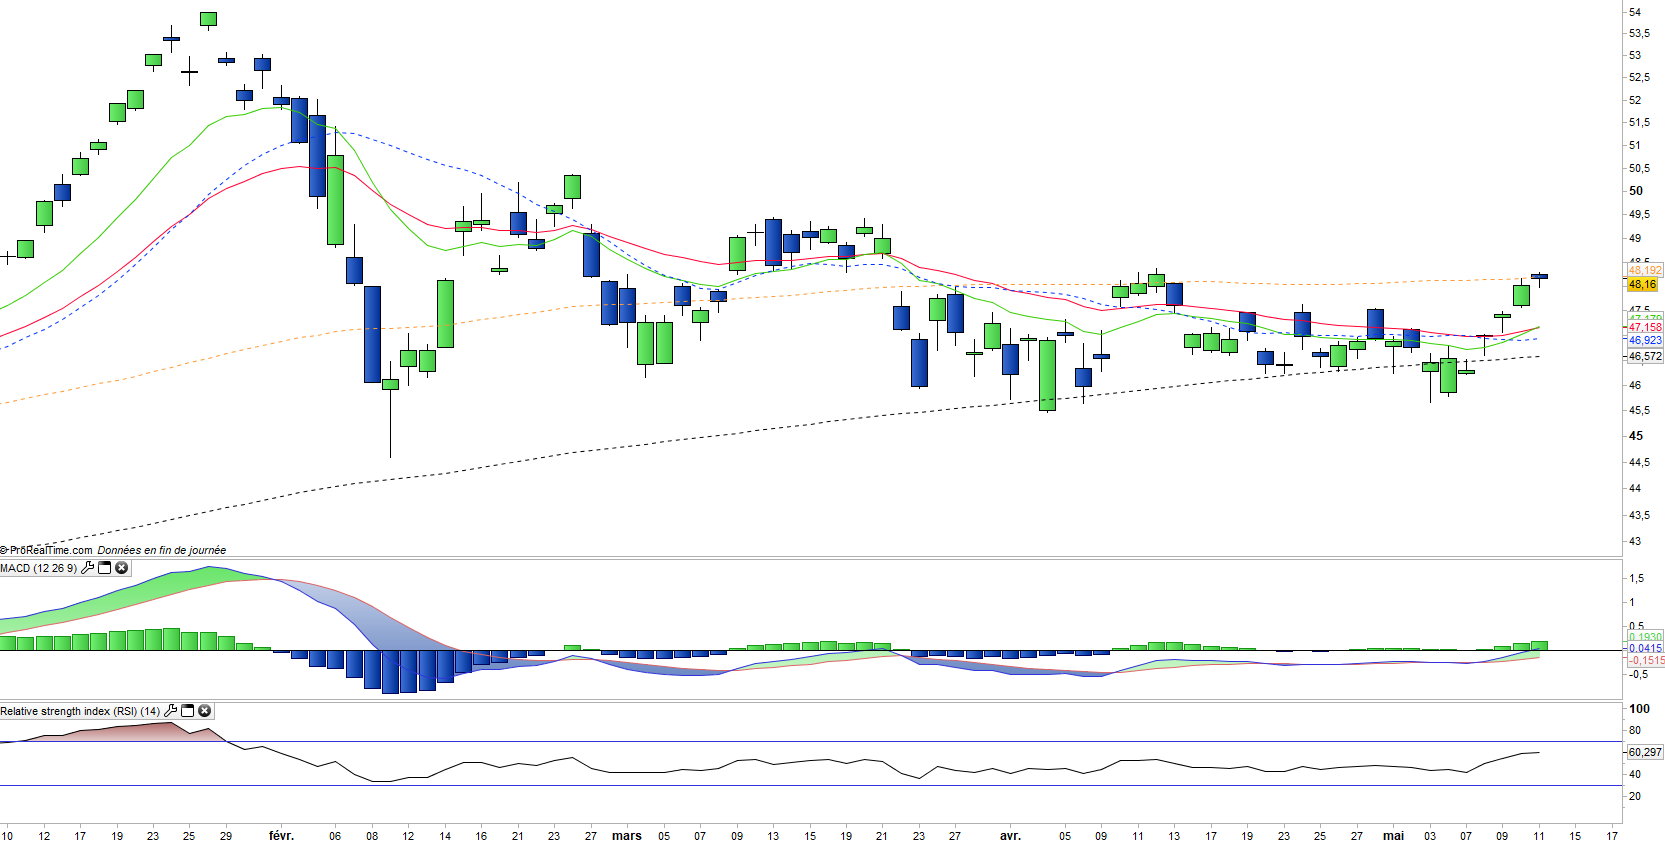
The analysis of the daily charts shows a bullish departure and a break of the bearish line which pleads for the end of the correction. The EMA100 has just been crossed up and the EMA13 and 26 have just crossed upward. The technical oscillators turned around, which confirms the bullish movement. Immediate resistance at $ 49 and $ 50 will have to be overcome to release the movement towards the peak of the year at $ 54.
ETF Objective
FXI is an ETF listed in USD, which seeks to replicate the FTSE China 50 (50 chinese companies)
Characteristics
| Inception date | 05/10/2004 |
| Expense ratio | 0,74% |
| Benchmark | FTSE China 50 |
| Code / Ticker | FXI |
| ISIN | US4642871846 |
| UCITS | No |
| Issuer | iShares |
| Currency | $ |
| Exchange | NYSE Arca |
| Assets Under Management | 4 578 M$ |
| Dividend | distribution |
| Currency Risk | Yes |
| Number of Holdings | 50 |
| Risk | 4/5 |
Country Breakdown
| China | 100% |
Sector Breakdown
| Financials | 48% |
| Energy | 13% |
| Information Technology | 11% |
| Real Estate | 10% |
| Telecom | 8% |
| Industrials | 5% |
| Others | 6% |
Top Ten Holdings
| China Construction Bank | 9% |
| Tencent Holdings | 9% |
| Industrial & Commercial Bank | 8% |
| Ping an Insurance | 6% |
| China Mobile | 5% |
| Bank of China | 4% |
| Cnooc | 4% |
| China Petroleum & Chemical | 4% |
| China Life Insurance | 3% |
| China Merchants Bank | 3% |