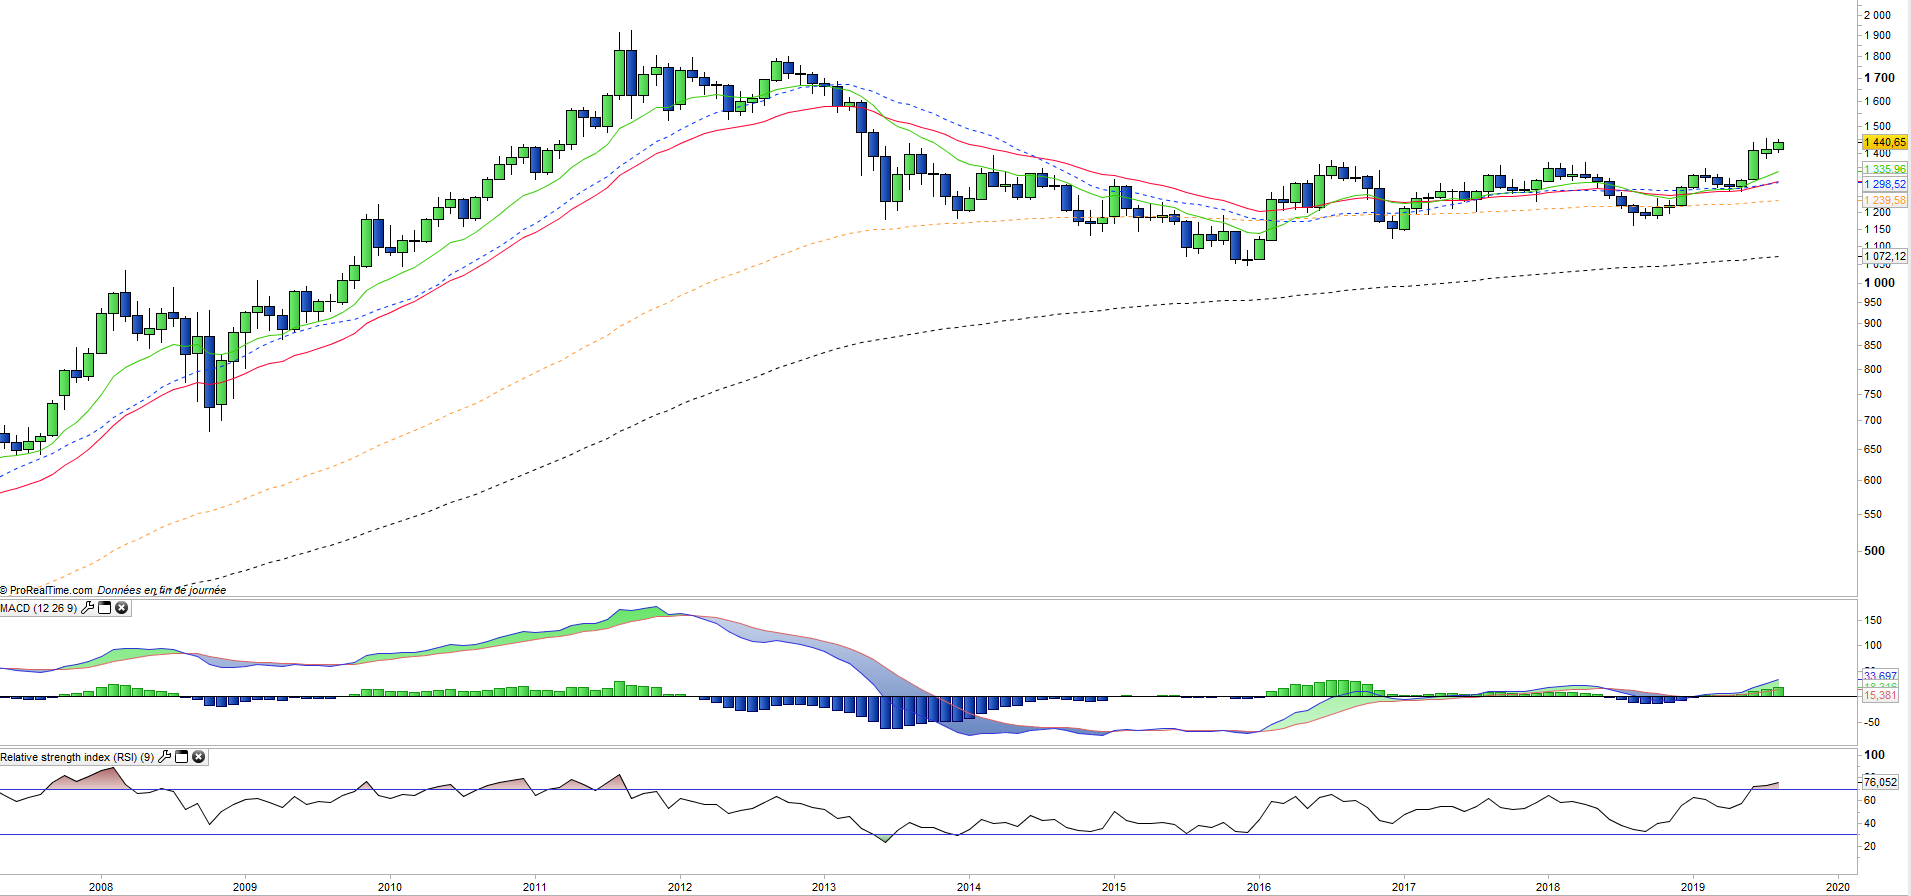
Gold has the particularity of not being correlated with equity and bond markets and has also been used as a safe haven since immemorial time, especially in periods of high inflation and financial crises, as we saw during the recent period (2007-2012) marked by the subprime crisis, then by the crisis on European peripheral debts.
In addition, Gold is sensitive to other factors such as central bank purchases and currently there are significant flows of purchases from central banks of emerging countries such as China and India.
The dynamics of US interest rates are also very important for gold prices as this precious metal naturally do not deliver dividends or coupon, so the Fed policy is a central issue for gold prices and if the Fed pause or soften the rate of hike in the coming months it should be beneficial for gold prices.
On the other hand, in the event of an inflationary spiral as in the 1970s, the very sharp rise in interest rates becomes good news for gold as a safe haven.
Gold can also be seen as a diversification alongside an equity portfolio, as the evolution of the precious metal is not correlated with economic cycles and can follow a very different evolution or opposite to the trend of stock indices, but not necessarily.
Finaly gold is denominated in US $, which can have a double effect since on the one hand the dollar is itself considered as a safe haven and the decline of the dollar tends to be favorable to commodities.
The FED's currently measured policy on rates and the significant threats of worsening trade conflicts between China and the US (or even with Germany and Japan), coupled with possible underestimated consequences of Brexit as well as the very large indebtedness of the largest economies (US, China, Japan, Europe) may favor a rebound of the yellow metal later on.
Instruments : BULLP (ETFS in EUR), IAU (iShares in USD), GLD (SPDR in USD), DGL (PowerShares in USD)