Invesco China Small Cap ETF (HAO) - 07/08/2018
Short Term strategy: Negative (0%) / Trend -
Long Term strategy: Negative (30%) / Trend -
Characteristics of the ETF
The HAO ETF (Invesco) initiated in 01/2008 aims to provide exposure to small-cap companies listed in China with a float-adjusted market capitalization of up to $ 1.5 billion and a minimum of $ 200M. At least 90% of the total assets are invested in common shares, American Depositary Receipts ("ADR"), American Depositary Shares ("ADS"), Global Depositary Receipts ("GDR") and International Depositary Receipts ("IDR"). Only shares open to foreign investors are included in the index. These include all Hong Kong-listed securities, including Chinese H and Red Chips, and N-Shares traded in New York and their counterparts traded in other foreign markets. Chinese A Shares and Chinese B Shares cannot be included in the Index. This index provides exposure to smaller, entrepreneurial and non-public companies in China that fit the Alpha Shares China Small Cap Index. The index is rebalanced and reconstituted annually.
This ETF is quoted in USD on NYSE and bears a 0.90% fee with AUM of approximately $74M. The replication method is straightforward and there is a dividend policy on an annual basis (usually in December).
Alternative ETFs: ECNS (iShares in USD)
Index & components
HAO is composed of 316 values, so it is a fairly deep index and very diversified from a sectoral point of view.
The industrial sector accounts for 16,8% of the capitalization, followed by IT (15%), real estate (15%), consumer discretionary (15%) and the mining sector (9.3%). It is interesting to note that financials represent only 6.2% of the index. The first capitalization of the index weighs only 1,3%, it is a real estate company (Sunac China Holdings), while the first 10 capitalizations represent only 11%, the risk is therefore very diversified.
Historically, small and medium-sized enterprises in China have contributed 50% of national tax revenues, 60% of GDP and 80% of employment, so they represent a good proxy for the Chinese economy. This is driven by fundamental trends, such as the digitization of the economy, which is growing rapidly, while e-commerce sales are worth € 701bn (Chinese statistics) and already represent half of the world total. Understand that in the US, 70% of Internet users are over 30, while in China it is the opposite 70% are under 30 years old. Mobile payment is also growing strongly, and online payments in China reached $ 5.5 trillion in 2016, almost fifty times more than the $ 112 billion spent on mobile in the United States, thanks in part to Alibaba's electronic wallets (Alipay) and Tencent (WeChat Pay), this new market is rapidly transforming the consumer behavior in China. The economy seems more and more supported by services and consumption, and the Internet is speeding up this process.
China is aiming for an upscaling of its economy and is automating a thigh speed; it has already become a leader in robotics and artificial intelligence. Chinese consumption has been rising since the beginning of the decade, rising from 35.4% in 2010 to almost 39% of GDP in 2016. However, many sectors, from heavy industry to energy and telecommunications, remain dominated by state-owned enterprises that are often deficient and unproductive, they are called "zombie companies", kept alive only with virtually unlimited credit, and accounting for 14% of loans distributed to industry in 2016, compared with 4 % in 2011. The maintenance of these structures is reflected in a worrying expansion of public and private debt, which amounts to nearly 250% of GDP.
Small caps are therefore an interesting way to play China's modernization, and we expect a growing weight of technology and services in the components of the index, while this is also the way to avoid major Chinese banks exposed to loss-making enterprises and their bad debts. However, Chinese small caps would probably be hit hard in the event of a financial crisis, and in case of a lasting trade war with the US, and there is also a monetary risk with the Yuan to be taken into account.
Latest developments
After an increase of 32.7% in 2017 (a performance comparable to the Chinese large cap) the index fell by nearly 7% in 2018.
The current period becomes more chaotic because of the commercial confrontation with the USA and the risk of suffering from new customs barriers that could be raised to 25% in early September by the US on more than $ 200 billion of imports which would represent cumulatively with the other actions already taken to about 50% of bilateral trade. China has announced that it will retaliate on $ 60 billion of US imports if these US threats come into effect. The rise of these protectionist actions, makes it less likely a short and negotiated outcome because no party can afford to lose face.
More structurally, the upscaling of the Chinese economy towards services and technology should be increasingly reflected in small-cap companies, which should therefore have an increasingly "growth" bias which is linked to the environment created by the rise of Chinese Tech through the Alibaba, Tencent and other Baidu that continue to grow even if they remain under the control of the government.
Monthly data
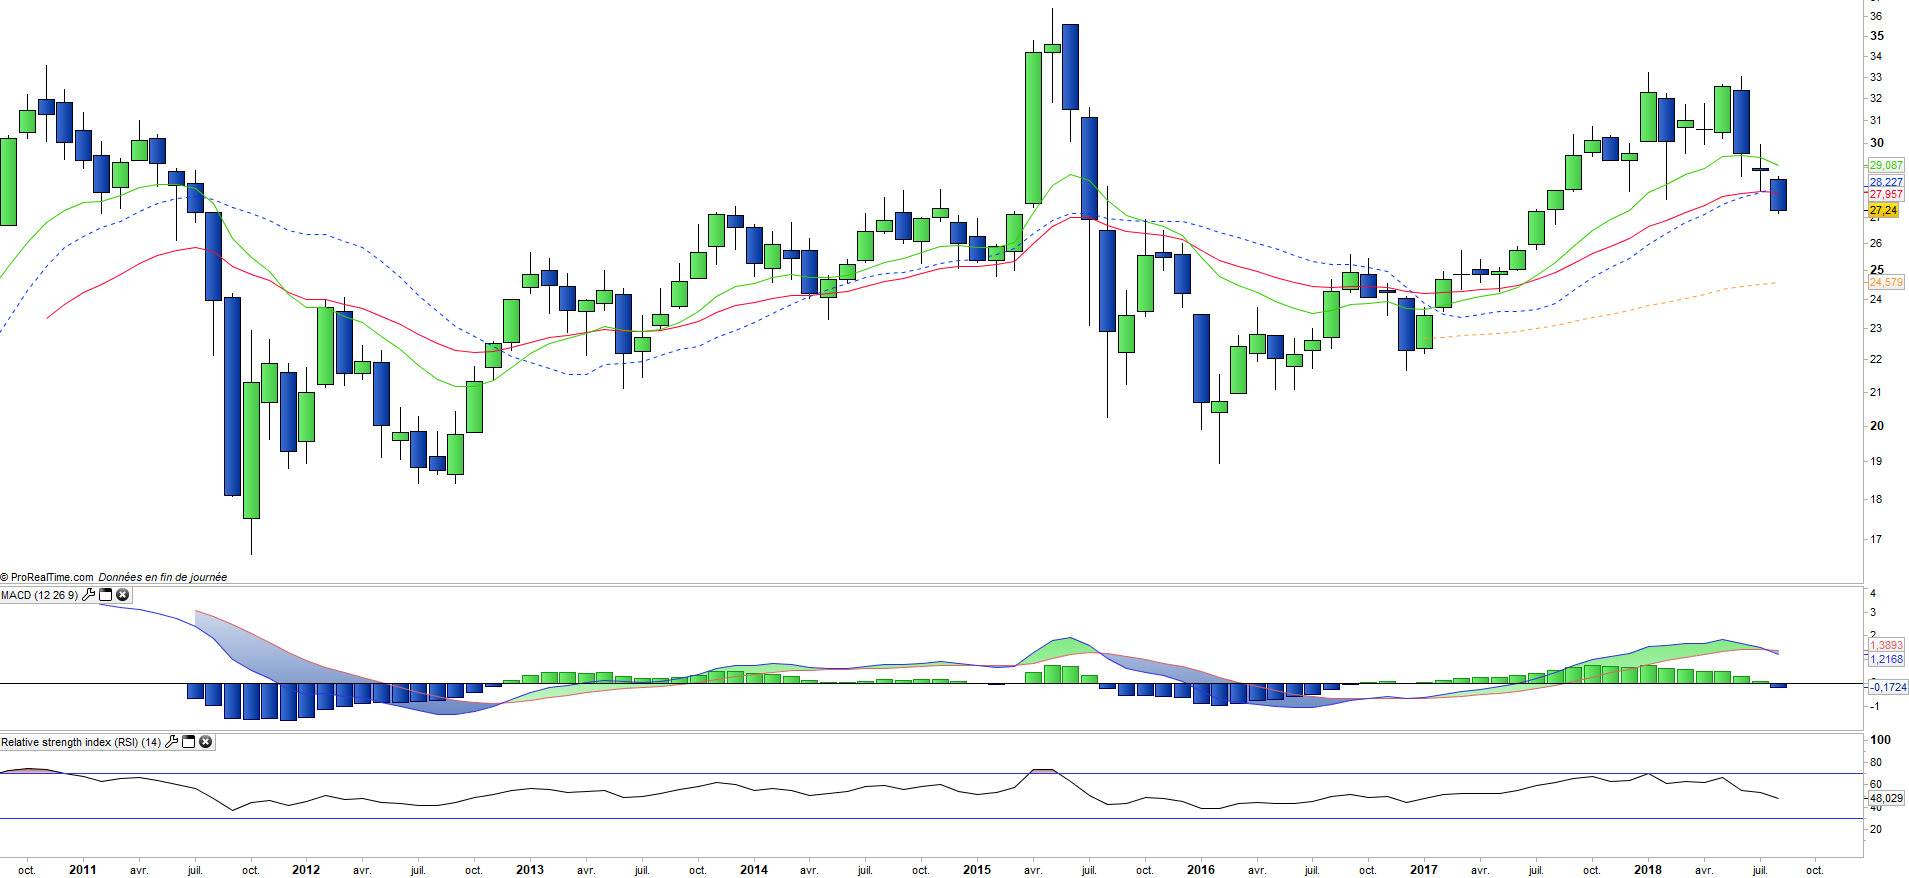
The monthly chart highlights a long-term bearish reversal whose ultimate goal could be the EMA100 located at around $ 24.6. We can observe a quite heavy summit structure that has led to the downward crossing of the EMA26 (to be confirmed at the end of the month) and the downward reversal of the MACD. This reversal has a medium / long term horizon and is probably halfway to its development.
Weekly data
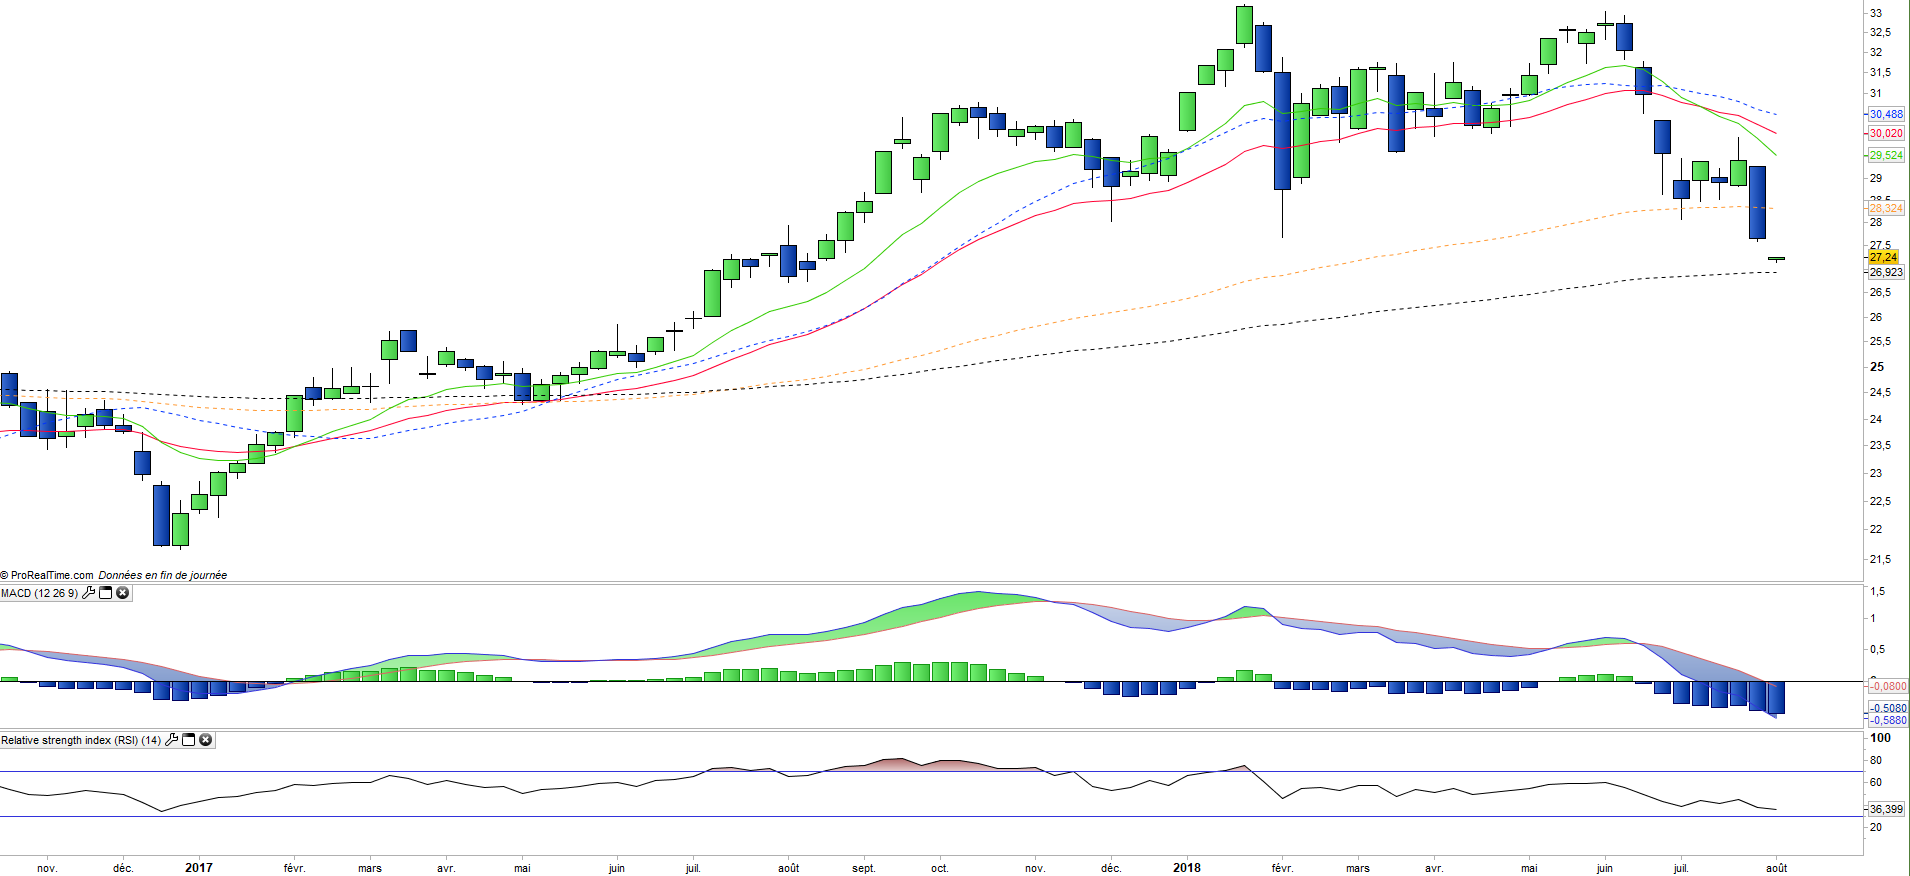
On the weekly chart, we see the formation of a medium-term peak that has led to a downward reversal of the trend. EMAs 13 and 26 have crossed lower and prices have just crossed the EMA100. Remains the EMA200 as the ultimate support, but the power of the movement suggests a further decline while the technical oscillators have reversed negatively with the MACD that crossed the zero line.
ETF Objective
HAO is an ETF listed in USD, which seeks to replicate the AlphaShares China Small Cap Index (316 chines companies)
Characteristics
| Inception date | 30/01/2008 |
| Expense ratio | 0.90% |
| Issuer | Invesco |
| Benchmark | AlphaShares China Small Cap Index |
| Code/Ticker | HAO |
| ISIN | US46138E7013 |
| UCITS | No |
| Currency | Dollar |
| Exchange | NYSE Arca |
| Assets Under Management | 74 M$ |
| Currency risk | Oui |
| Number of Holdings | 316 |
| Risk | 4/5 |
Country Breakdown
| Hong Kong | 80% |
| China | 14% |
| USA | 6% |
Sector Breakdown
| Industrials | 17% |
| Real Estate | 15% |
| Information Technology | 15% |
| Consumer discretionary | 15% |
| Materials | 9% |
| Health Care | 8% |
| Financials | 6% |
| Others | 13% |
Top Ten Holdings
| Momo Inc | 1% |
| Zall Smart Commerce Group | 1% |
| Kingdee Intl Sotfware Group | 1% |
| Wuxi Biologics Cayman Inc | 1% |
| Jiayuan Intl Group | 1% |
| China First Capital Group | 1% |
| Yanzhou Coal Mining Co Ltd | 1% |
| China Resources Cement | 1% |
| Zijin Mining Group | 1% |
| Genscript Biotech Corp | 1% |
[/groups_member]