iShares 7-10 Year Treasury Bond ETF (IEF) - 02/08/2018
Short Term strategy: Negative (10%) / Trend -
Long Term strategy: Negative (5%) / Trend -
Characteristics of the ETF
The ETF IEF (iShares) created in 07/2002 and which is listed on the Nasdaq in USD aims to replicate an index, the ICE US Treasury 7-10 Year Bond Index composed of US Treasury bonds with maturities between 7 and 10 years old. This index is composed of 10 variable maturity, with yields generally ranging between 1.5 and 2.4%.
The fee for this ETF is 0.15% and the AUM are approximately $ 8 700M. Replication is direct (physical) and there is a coupon distribution policy.
Alternative ETFs: US10 (Lyxor in USD), VGIT (Vanguard in USD),
Index & components
The ETF ETF captures the long end of the US yield curve in a very liquid ETF. Holders of medium to long-term bonds, IEF is naturally very correlated to the fluctuations of the benchmark, the US 10 years T-bond. IEF is a very liquid ETF with reasonable fees and satisfactorily replicates its index, which makes it a good support for investors who want exposure close to the 10Y US bond. The quality of these bonds makes this ETF a safe haven in moments of doubt about the global economy.
During the 2007/2008 financial crisis, IEF grew by 13.2% in 2008 as the S & P500 suffered the collapse of Lehman Brothers and declined by 38.5%. In 2009, the opposite movement was observed during the market recovery with a 10.1% decline in IEF and a 23.5% increase in the S & P500. At other important moments, such as the loss of the triple A US in 2011, IEF once again played the role of safe haven and posted a rise of 12.5%.
However, this is a product sensitive to inflation and interest rates because yields remain moderate compared to high yield stocks or bonds. At the time of the election of D.Trump at the end of 2016, this ETF was under pressure with an associated drop of about 5% because the program of Mr Trump considered inflationary by the markets because of massive projects in infrastructure and tax cuts, made the equity market (in particular the cyclical compartment) much more attractive, while the yield on long- and medium-term government bonds became much less attractive.
More generally, IEF is linked to the robustness of the US economy, the current US dollar-based leadership system and the effectiveness of the Fed's monetary policies to avoid both deflation and inflation while maintaining growth potential of around 3%. This ETF may be inversely correlated with the equity markets as well as during the financial crisis, but this is not necessarily the case. Volatility can be significant when important events occur.
We consider this ETF to be very useful in an arbitrage strategy with the equity market during periods of severe turbulence and during periods of low inflation.
Latest developments
US 10-year bonds have fallen about 8% since their peak of summer 2016, which corresponds to 10-year rates of 2.85%.
If rates were to return to 3.5% this would correspond to a decline of about 20% in US bonds. This decline is manageable if it is spread over time, but would turn into a bond crisis if it were to intervene quickly, in a few weeks or in 2 or 3 months. This rapid increase would weaken the balance sheets of already heavily leveraged companies, and would increase the default rate in the high yield compartment, which would weaken the banks in a second time and cause a crisis in the equity markets.
The good health of the US economy that experiences full employment while GDP growth is expected at 3% in 2018 is part of the explanation. The risks of tension on wages are becoming more important, especially as plans for stimulus by lower taxes and infrastructure plans are underway. The decline of the dollar against other currencies is also a source of inflation, so the risks are clearly on the upside.
Monthly data
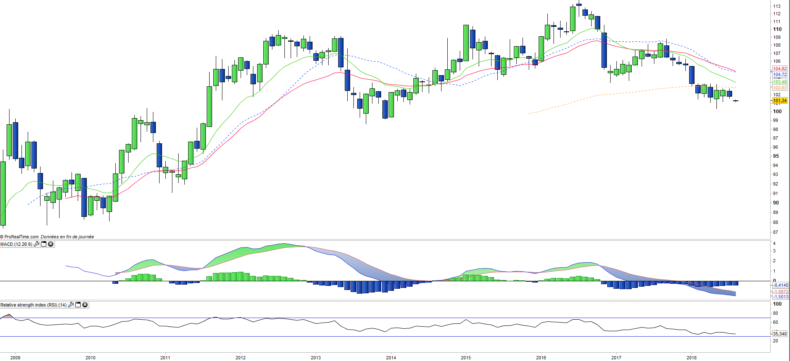
The monthly chart of the T-Bonds 10Y US shows a declining trend that asserts itself. The monthly moving averages 13 and 26E are descending, which was confirmed by the MACD, which broke through its zero line. The first objective is the resistance of $ 100, which in case of bearish breakout would open a target toward $ 88.
Weekly data
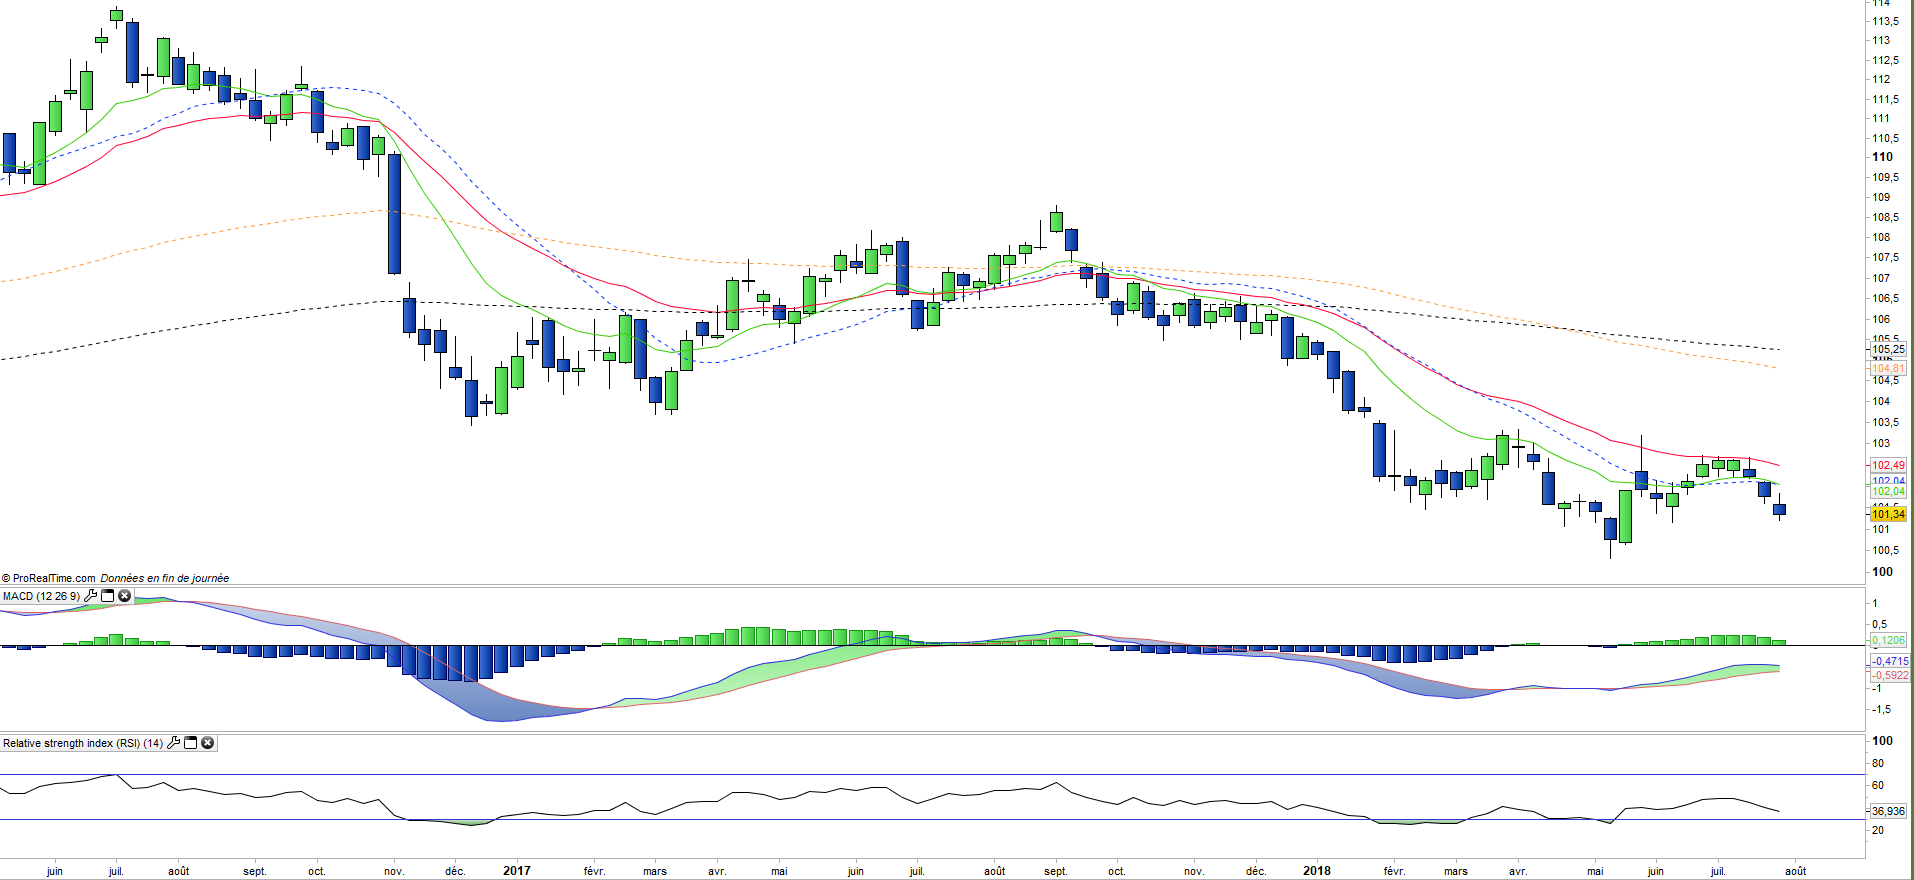
On the weekly chart, we can identify that the medium-term downtrend is settling after crossing many support lines and pull backs on the EMA26. The moving averages are down and the recent rebound has failed, however the major support at $ 99 has not been crossed yet and should lead to a wider rebound. In the event of a downward crossing, the downside potential would be much greater.
ETF Objective
IEF is an ETF listed in $, which seeks to replicate the ICE U.S. Treasury 7-10 Year Bond Index
Characteristics
| Inception date | 22/07/2002 |
| Expense ratio | 0,15% |
| Benchmark | ICE U.S. Treasury 7-10 Year Bond Index |
| Issuer | iShares |
| Ticker | IEF |
| ISIN | US4642874402 |
| UCITS | No |
| Currency | $ |
| Exchange | Nasdaq |
| Assets Under Management | 8 700 M$ |
| Replication method | Direct (physical) |
| Dividend | Yes |
| Currency risk | No |
| Number of Holdings | NA |
| Risk | 3/5 |
Country Breakdown
| USA | 100% |
Breakdown by notation
| AAA | 100% |
Top Ten Holdings
| TREASURY NOTE 2027 2.38% | 21% |
| TREASURY NOTE 2026 1.63% | 15% |
| TREASURY NOTE 2027 2.25% | 14% |
| TREASURY NOTE 2026 1.63% | 14% |
| TREASURY NOTE 2027 2.25% | 13% |
| TREASURY NOTE 2026 2,00% | 9% |
| TREASURY NOTE 2027 2,25% | 7% |
| TREASURY NOTE 2026 1.50% | 3% |
| TREASURY NOTE 2028 2.75% | 2% |
| TREASURY NOTE 2027 2.25% | 2% |