The IEO ETF (iShares) created in 05/2006 and listed on the Nyse in USD, reproduces an index based on a selection of 63 stocks specialized in the oil and gas exploration and production. The tracked index is the Dow Jones U.S. Select Oil Exploration & Production Index. This is a very specialized index from a geographical point of view, composed mainly of US stocks and quoted in USD.
The fee for this ETF is 0.44% and the amount of AUM is approximately $ 347M. The replication method is direct and there is a dividend distribution policy.
Alternative ETFs: XOP (SPDR in USD), PXE (Powershares in USD)
Index & components
The IEO ETF replicates a very specialized index from a geographical point of view, composed mainly of US stocks and quoted in USD, but also from a business point of view with 77% of specialists in exploration & production, and for the rest of the companies specializing in refining and transport. In addition, we consider that the index is rather well diversified from a value point of view with 63 securities that make it up.
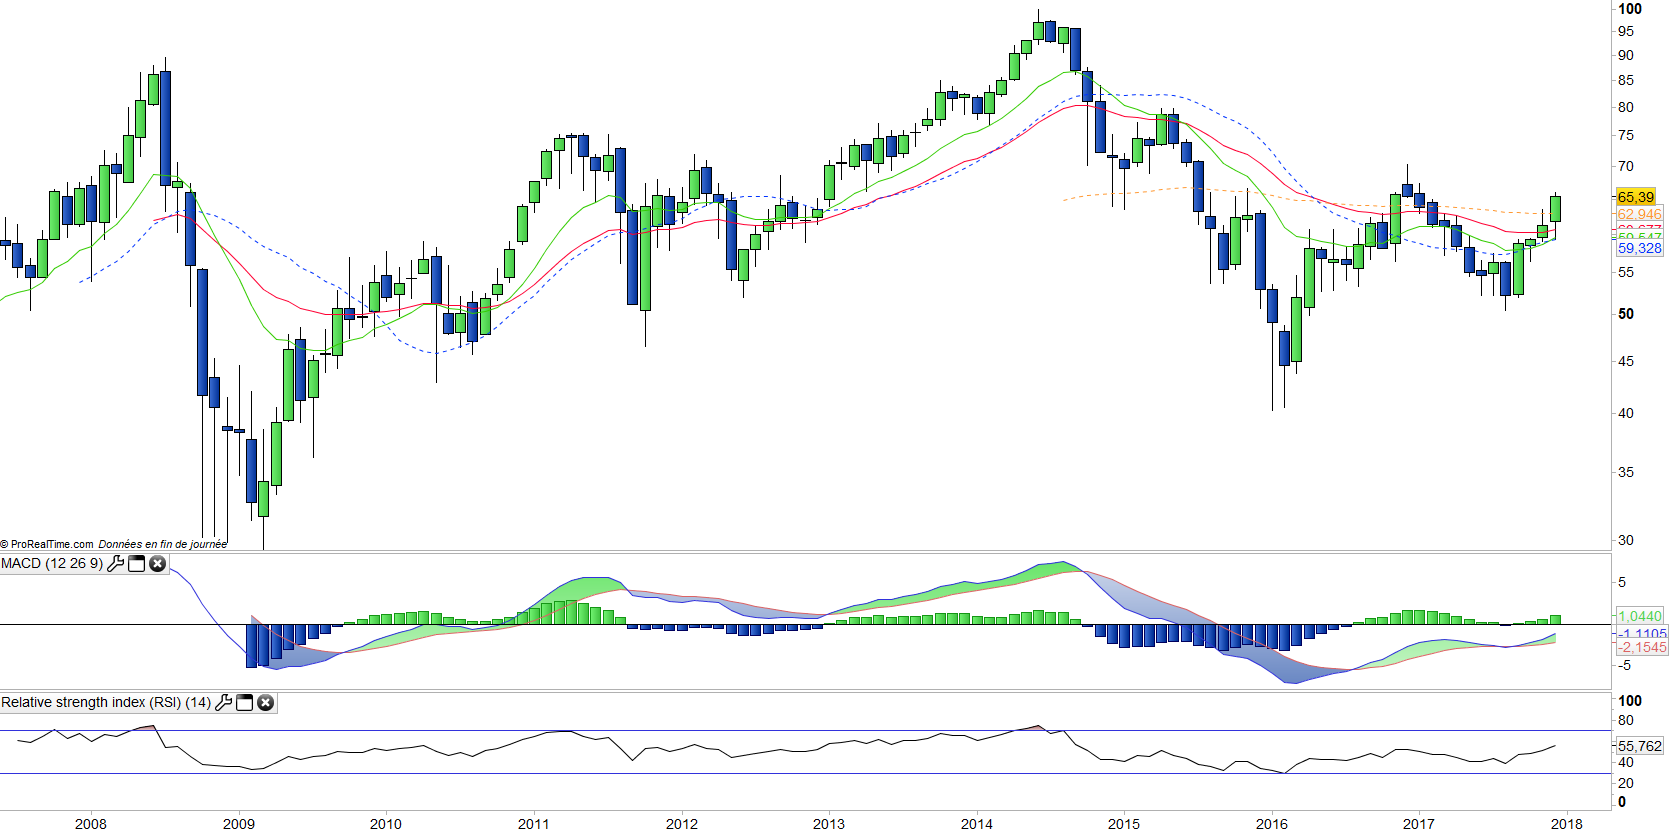
This index has experienced high volatility, in correlation with changes in the price of a barrel: in June 2014, the ETF reached a peak of $ 100 before a decrease to around $ 40 in early 2016 in the wake of the fall in crude oil, this is a very volatile and risky index. However, since its creation in 2006 the ETF has posted a cumulative positive performance of around 26% which is better than the evolution of the barrel.
In the main components of the index will be actors specialized in the exploration and production of shale gas and oil such as EOG, Concho or Pioneer, which have a much lower cost base than the so-called conventional oil companies, as well as greater flexibility and adaptability to crude prices. We consider that the price of oil should evolve between $ 50 and $ 80 in the coming years due to a gradual increase in demand and a lower supply resulting from the shutdown of investments for 3 years in the wake of the lower prices. Unconventional exploration / production companies are expected to outperform in the context of oil prices above $ 50, thanks to their lower cost base. However, the importance of shale production (c. 1million barrels / day according to some sources) is likely to limit the upside potential.
In the longer term, the electric car and the ongoing innovations in renewable energies (grid) could have a powerful deflationary effect on oil prices, while the energy component in GDP growth is decreasing due to the increase in the share of services (especially in China and India). We consider this ETF to be very qualitative given its small deviation in time from the benchmark. The outlook for 2018 is encouraging, while companies in the sector have sharply reduced their breakeven, their margins are at the bottom of the cycle, with a barrel that could rise in the next two years.
Latest developments
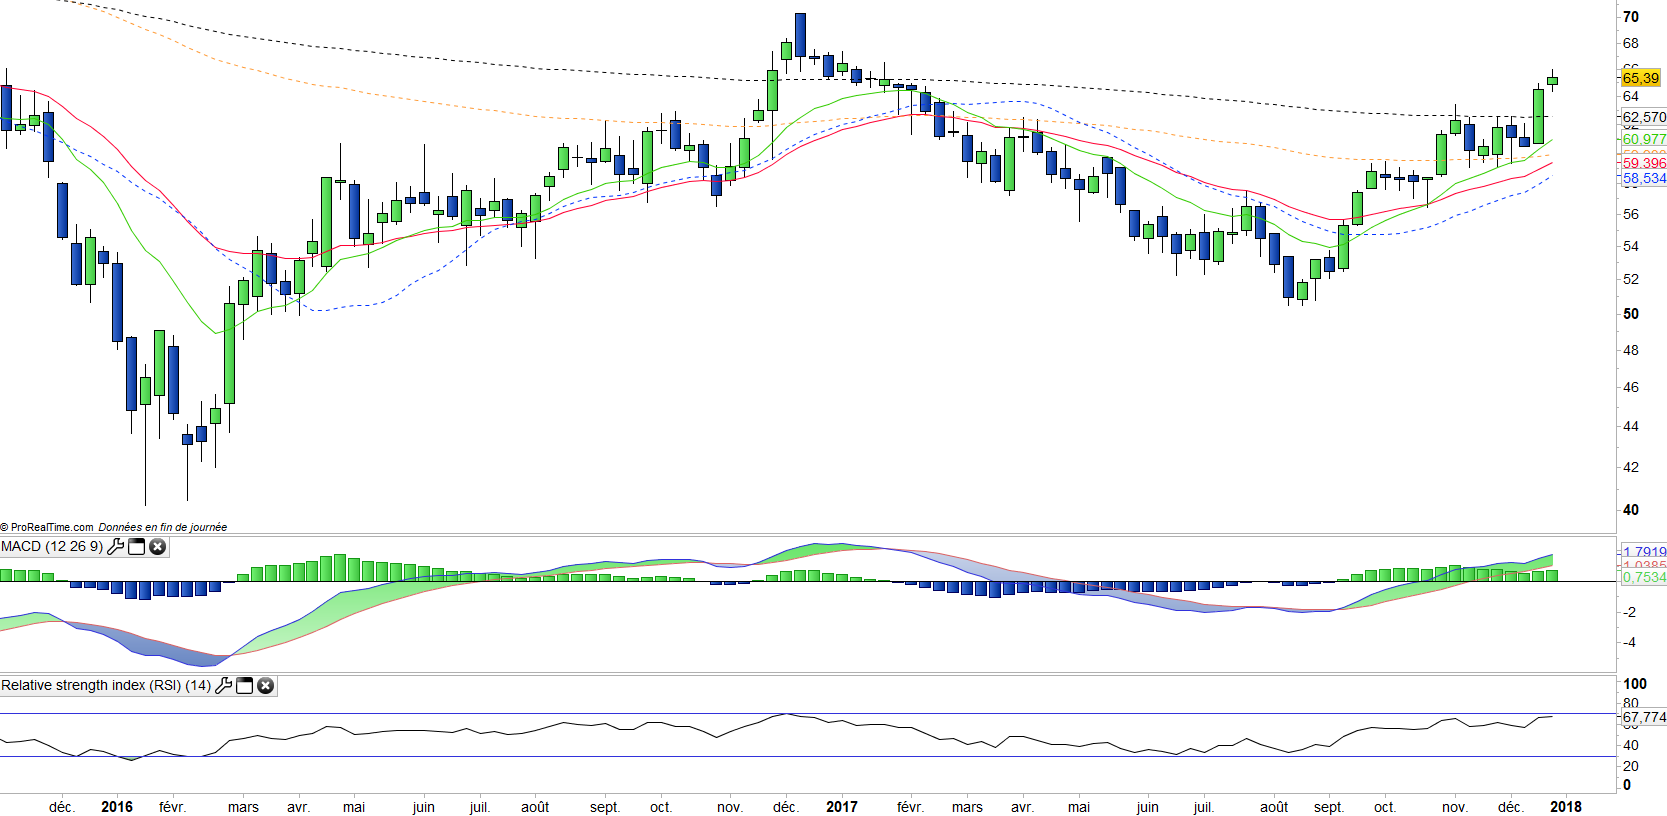
The performance of IEO is -0.4% since the beginning of the year, compared to + 19.8% on the S & P500, and after a rise of 23.6% in 2016. However, IEO has grown by almost 30% since September, in the wake of the rise in crude oil and the restart of some projects.
The extension of the OPEC agreements until the end of 2018 will set a floor for oil prices, while the strong global growth (+3.6% in 2017) is likely to continue in 2018 and should help to balance the market . The planned fall of Venezuela, the various pipeline incidents and geopolitical tensions remind us that the balance remains fragile. In addition, the lack of investment in exploration / production over the last three years will not be fully met by shale oil, whose rate of growth in production could find limits in terms of infrastructure. The operational leverage of the exploration / production companies is at a high level and the recovery of projects that should accompany the rise in oil prices should have a very significant impact on margins.
The market's potential for sector rerating seems significant in the medium term.