The Lyxor INS ETF (UCITS), created in 08/2006 is listed in Euro on Euronext and replicates the Stoxx 600 Europe Insurance NR index which is composed of the 34 main European insurance values.
It should be noted that stocks outside the euro zone represent 46% of the index, which is not insignificant given the potentially significant fluctuations of the £ and CHF against the Euro.
The cost of this ETF is 0.3% and the AUM is approximately € 62m, against € 1005m for BNK, which replicates the European banking sector. The replication method is indirect (via a swap) and the distribution method is capitalized.
Alternative ETFs: SYI (BNP Theam in Euro), EXH5 (iShares in Euro)
Index & components
The stocks in this index are mainly British (26.5%), German (24.8%), Swiss (16.4%) and French (12.3%). The top 10 stocks of the index represent 70% of the weighting, among which we find giants like Allianz, Axa, Prudential or Zurich Insurance Group.
About 54% of companies in the index are listed in Euro, the other part mainly in Pounds Sterling and Swiss Francs.
The insurance sector is largely influenced by the macroeconomic environment that directly conditions demand, except for the insurance-damage component, which depends on statistical and exogenous factors. More specifically, interest rates are the main factor of performance because they make insurance products (including life insurance) more or less attractive. They also largely determine profitability because insurers, as long-term savers, invest premiums primarily in bonds.
In recent years, low interest rates imply a contraction in spreads that negatively impacts profits. However, only new premiums are invested at lower returns, and insurers can rely on higher rate levels from previous years that allow for some smoothing. When investment returns are falling, insurers clearly need to improve their bottom line and portfolio management becomes the engine of performance. The quest for return requires a gradual return to risky assets or alternative investments. It also implies that geographic exposure has a strong impact on sales depending on the country's macroeconomic environment and also on the balance sheet because insurers tend to invest their assets in the same area as their liabilities.
The rise in the sector remains a bet on the rise in long-term interest rates, which seems well underway in the United Kingdom while the euro zone should follow thereafter, while the ECB is just starting to give the first signals of future normalization of its monetary policy, with a view to a gradual reflation of the European economy.
Latest developments
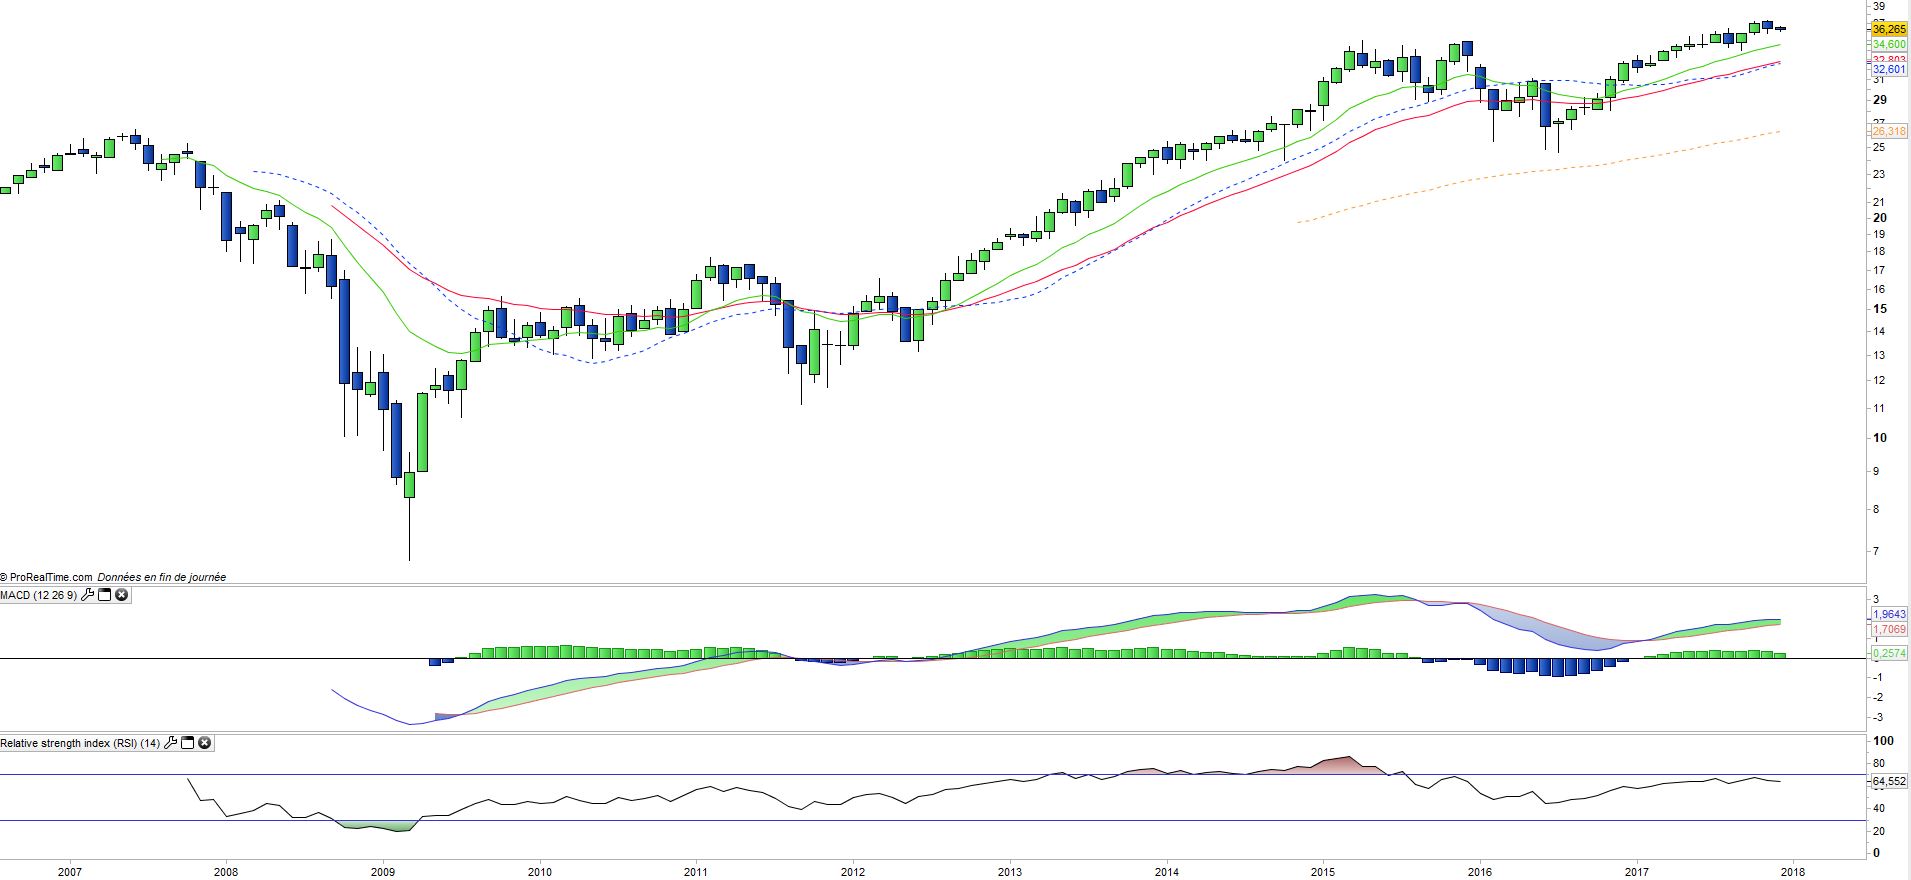
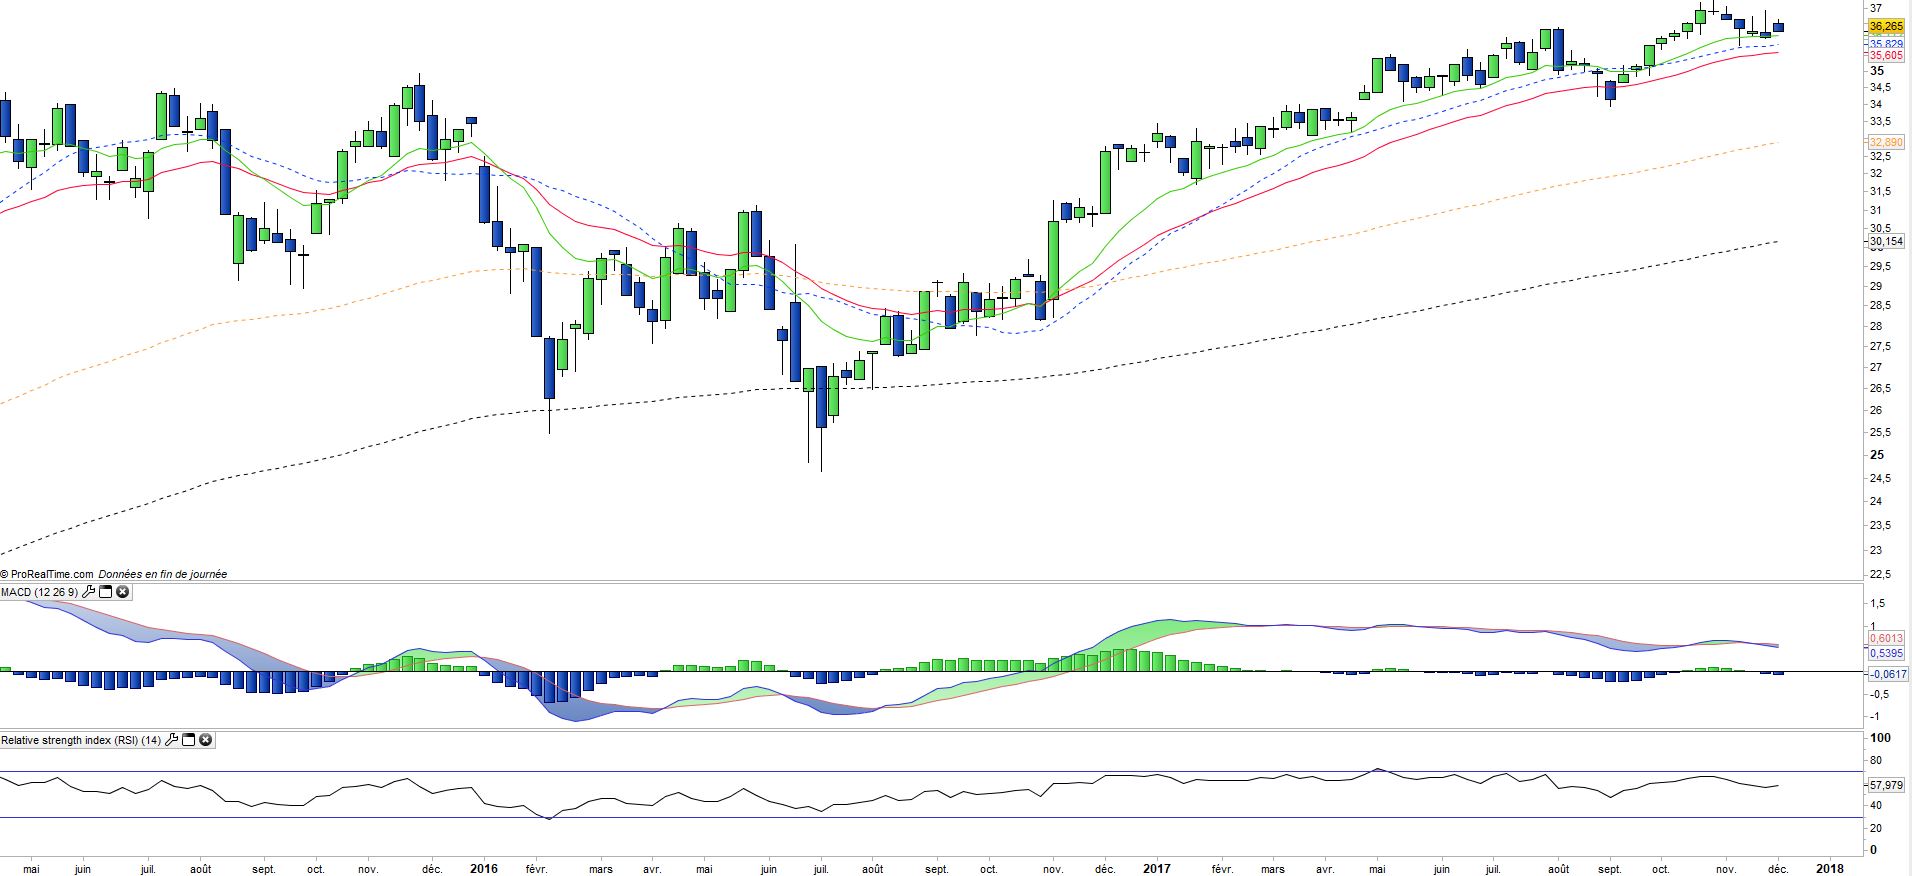
After a very strong correction at the time of the financial crisis, which saw this ETF go from € 26.4 in 07/2007 to € 6.8 in 03/2009, INS then gradually recovered in 2015 to 33, 4€ well above its pre-crisis levels.
2016 was a year of slight consolidation (-2.5%) due to the fall in interest rates, but in 2017 INS resumed its upward path (+ 11.2%), which strengthened with the recovery in European growth and equity markets, while major players are increasingly involved in asset management, which represents a growing share of their profits. After a difficult autumn for the "damage" business due to the number of natural disasters, the insurance sector is currently benefiting from good asset management inflows - due to the good orientation of the equity and bond markets - and elsewhere productivity gains are made possible by digitization, while in the longer term the blockchain should become a strategic topic for the sector.
The sector pays about 11x 2018 earnings, which is much lower than the Stoxx600 (15.5x) while the average yield is very high at around 5% which is a strong support for investors.