The IWM (Ishares) ETF replicates the RUSSELL 2000 Index, which is a subset of the Russell 3000 Index of the 3,000 largest US companies representing approximately 98% of the US market capitalization. The Russell 2000 Index represents only about 10% of the market capitalization of the Russell 3000 and consists of approximately 2,000 small cap companies ($ 2.2bn market cap on average). The Russell 2000 Index seeks to be truly representative of the mid-cap segment, and is fully reconstituted each year to ensure that larger caps do not distort performance and that corporate characteristics actually correspond to the mid-cap segment.
The ETF IWM is currently the benchmark tracker for replicating this US small cap index with fees limited to 0.19% and AUM of $ 45106M. Replication is direct (physical) and there is a dividend distribution policy on a quarterly basis.
Alternative ETFS: VTWO (Vanguard in USD), RUS2 (Lyxor in USD)
Index & components
The Russell 2000 Index is a very broad index that can be used to profoundly address the US mid caps universe.
The interest of this index is in addition to the high number of components, characterized by the great diversity of the sectors addressed: the financials (c.18%), the technological compartment (c.14%), the industry (c.15). %), health (c.16%) and consumer goods (c.12%) are the main sectors, in a very balanced index which in the end looks very representative of the US economy. However, we can notice that growth themes are more represented, compared to sectors considered as mature, such as energy (4.5%), utilities (3.4%) or telecommunications (3.3%), which are historically heavily represented in the big indices like the Dow Jones for example.
The Russell 2000 valuation multiples are not really higher than those of the large-value indices, with currently a 18x earnings PER at 12 months forward versus 16.5x for the S & P 500 and 19x for the Nasdaq. In addition, the companies that make up the Russell 2000 are often companies that are already well structured internationally and therefore in a position to take full advantage of the recovery of the global cycle. These companies, by their average size, are more sensitive to the economic cycle and should therefore record higher growth rates than large companies in the coming months, especially since the margins of large US companies are already at an historical high level. The small valuation differential with respect to the major indices may therefore appear as an opportunity in that the growth gap could be quite large.
The new round of rate hikes will, according to the latest Fed statements, be very gradual and should not pose a short-term threat to US growth in the coming months as the dollar is falling against the Euro and other currencies which should fully benefit medium-sized US companies.
Latest developments
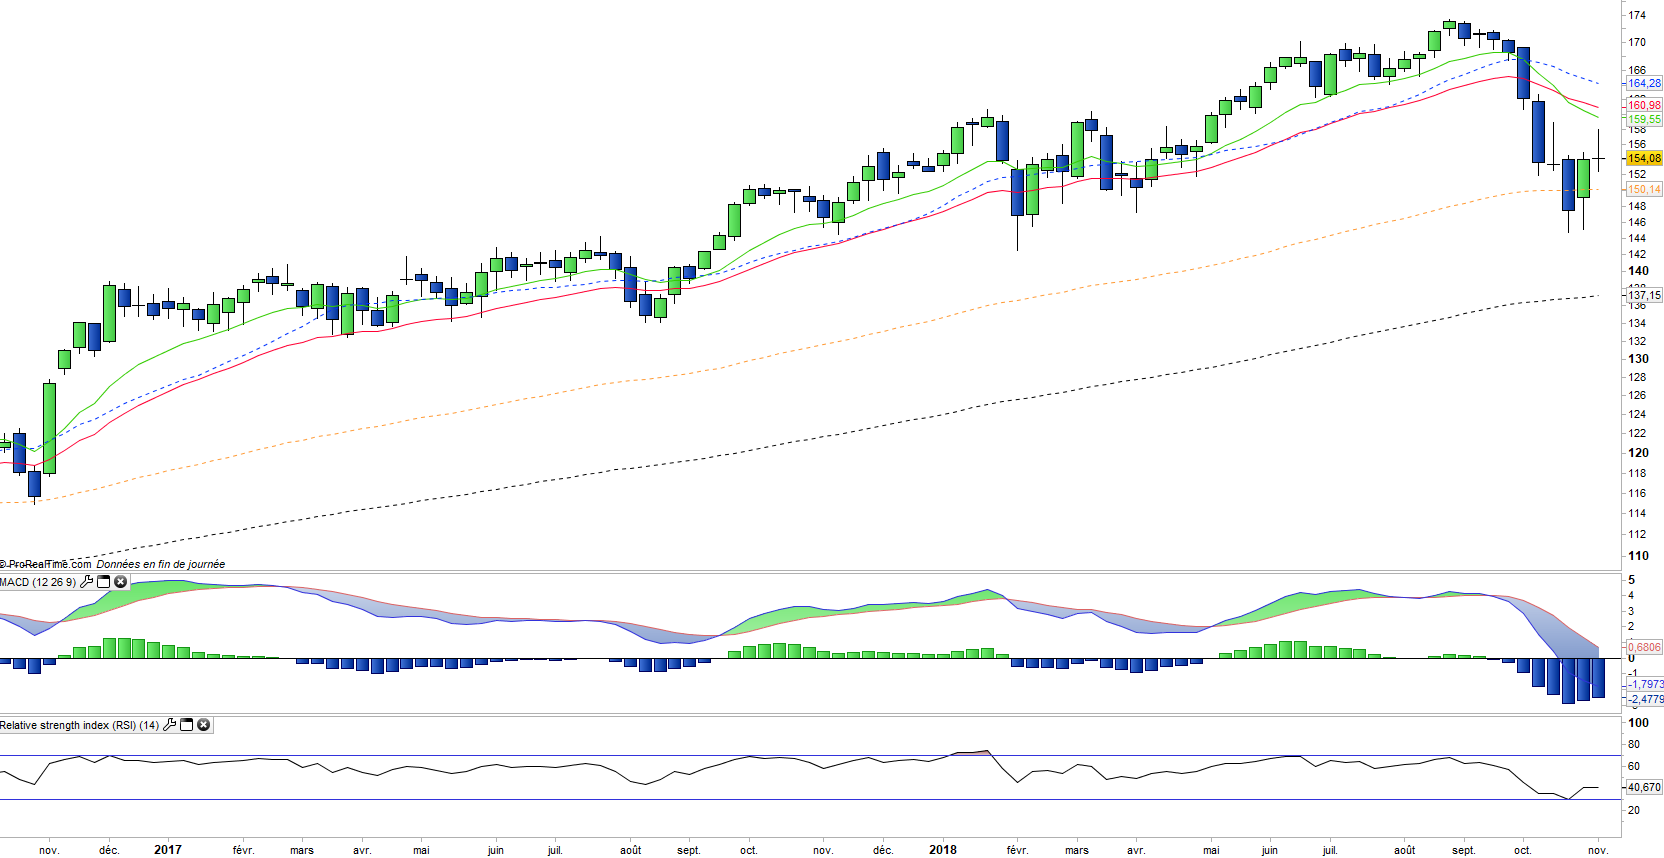
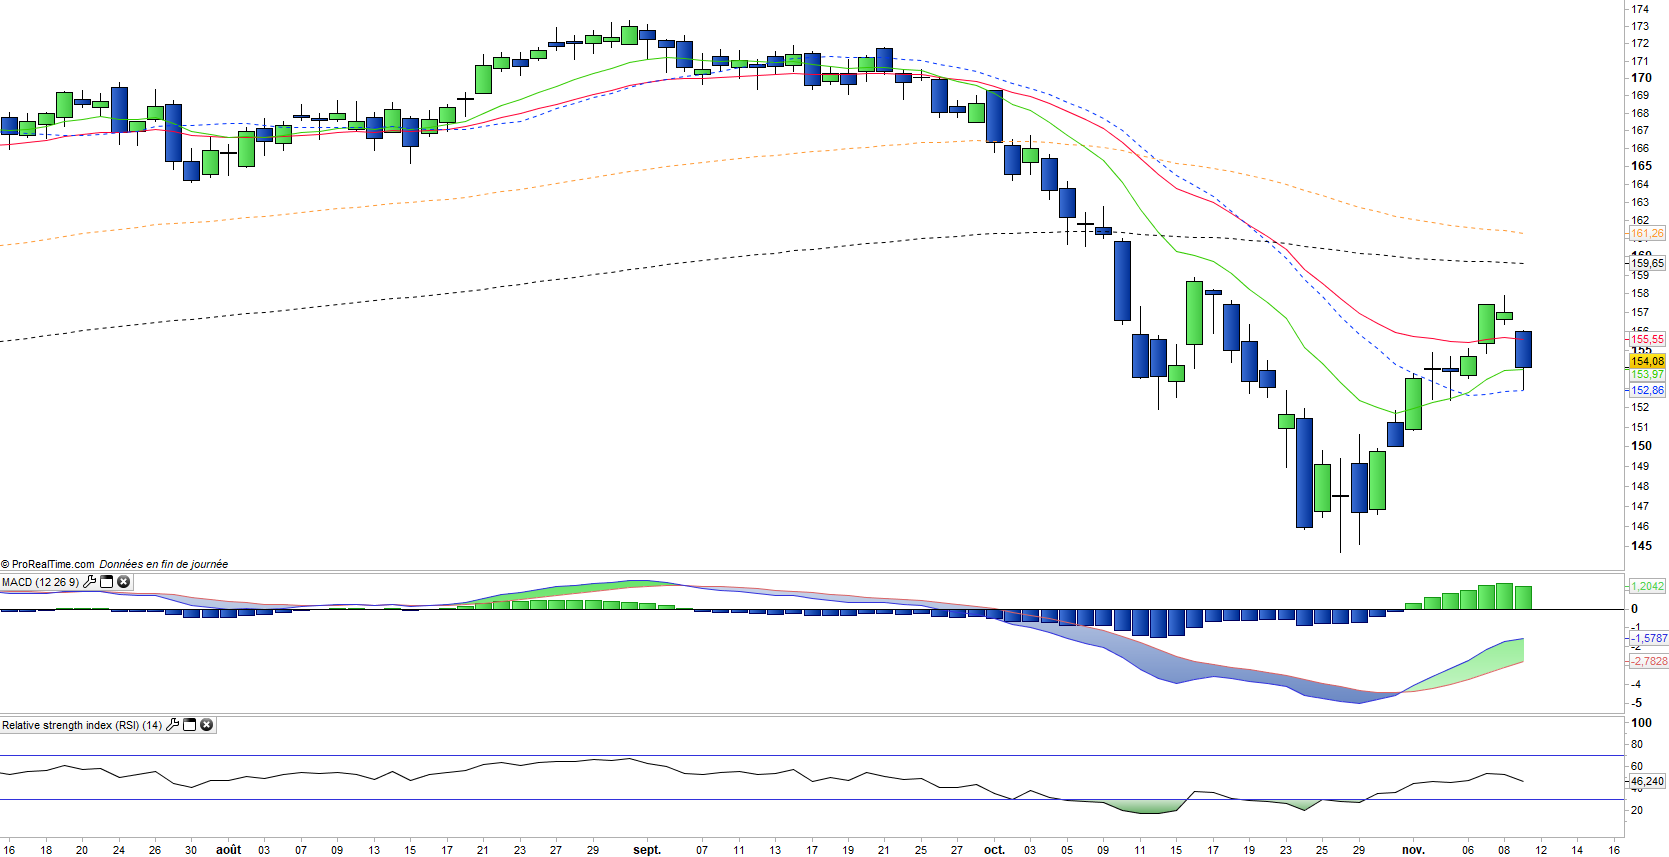
The Russell 2000 is flat since the beginning of the year (against + 4% for the S & P500), after a rise of 13% in 2017 (against + 19.4% for the S & P500).
The Russell 2000 is currently the weakest link in the US market, with the smallest increase compared to the large US indices, which shows a certain risk aversion. The markets look at these divergences a lot, as the Russell2000's downtrend or waning trend is often seen as a leading indicator of the fall in the major indices. The Russell 2000 is considered an "amplifier of the trend". This divergence can hardly be explained by sectoral biases, and more naturally by a certain breathlessness of the theme of growth in the context of a rise in short term interest rates by the FED and the rise in long-term interest rates.
The markets seem to be once again favoring so-called "value" themes offering dividends and a certain security of results, rather than values offering high growth potential coupled with demanding multiples. However the average P / E of the index is 18x the 12 months forward results against 16.5x for the S & P500 which remains acceptable for double-digit growth rates, achievable if the US economy continues to grow at a reasonable rate.