The IWM (iShares) ETF replicates the RUSSELL 2000 Index, which is a subset of the Russell 3000 Index of the 3,000 largest US companies representing approximately 98% of the US market capitalization. The Russell 2000 Index represents only about 10% of the market capitalization of the Russell 3000 and consists of approximately 2,000 small cap companies ($ 2bn market cap on average).
The Russell 2000 Index seeks to be truly representative of the mid-cap segment, and is fully reconstituted each year to ensure that larger caps do not distort performance and that corporate characteristics actually correspond to the mid-cap segment.
The ETF IWM is currently the benchmark tracker for replicating this US small cap index with fees limited to 0.19% and AUM of $ 41456M. Replication is direct (physical) and there is a dividend distribution policy on a quarterly basis.
Alternative ETFs: VTWO (Vanguard in USD), RUS2 (Lyxor in USD)
Index & components
The Russell 2000 Index is a very broad index that can be used to profoundly address the universe of US mid caps.
The interest of this index is in addition to the high number of components, characterized by the great diversity of the sectors addressed: the financials (c.18%), the technological compartment (c.14%), the industry (c.15). %), health (c.16%) and consumer goods (c.12%) are the main sectors, in a very balanced index in the end and very representative of the US economy. However, we can notice that the growth themes are more represented, compared to sectors considered as defensive as for exemple energy (3.8%), utilities (3.8%) or telecommunications (3.4%) which are historically heavily represented in the big indices like the Dow Jones or the S&P500.
The valuation multiples of the Russell 2000 are currently not really higher than those of the major indices. Moreover, the companies that make up the Russell 2000 are often companies that are already well structured internationally and therefore in a position to benefit fully from the recovery of the global cycle, but which are also more economically sensitive by their average size. The small valuation differential against large indices may appear as an opportunity as the growth gap could be quite large if US growth remains robust.
The rate hike cycle will remain, according to the latest Fed statements, gradual and should not pose a threat in the short term, but many risks are weighing on US economic growth whose cycle could come to an end by 2020 .
Latest developments
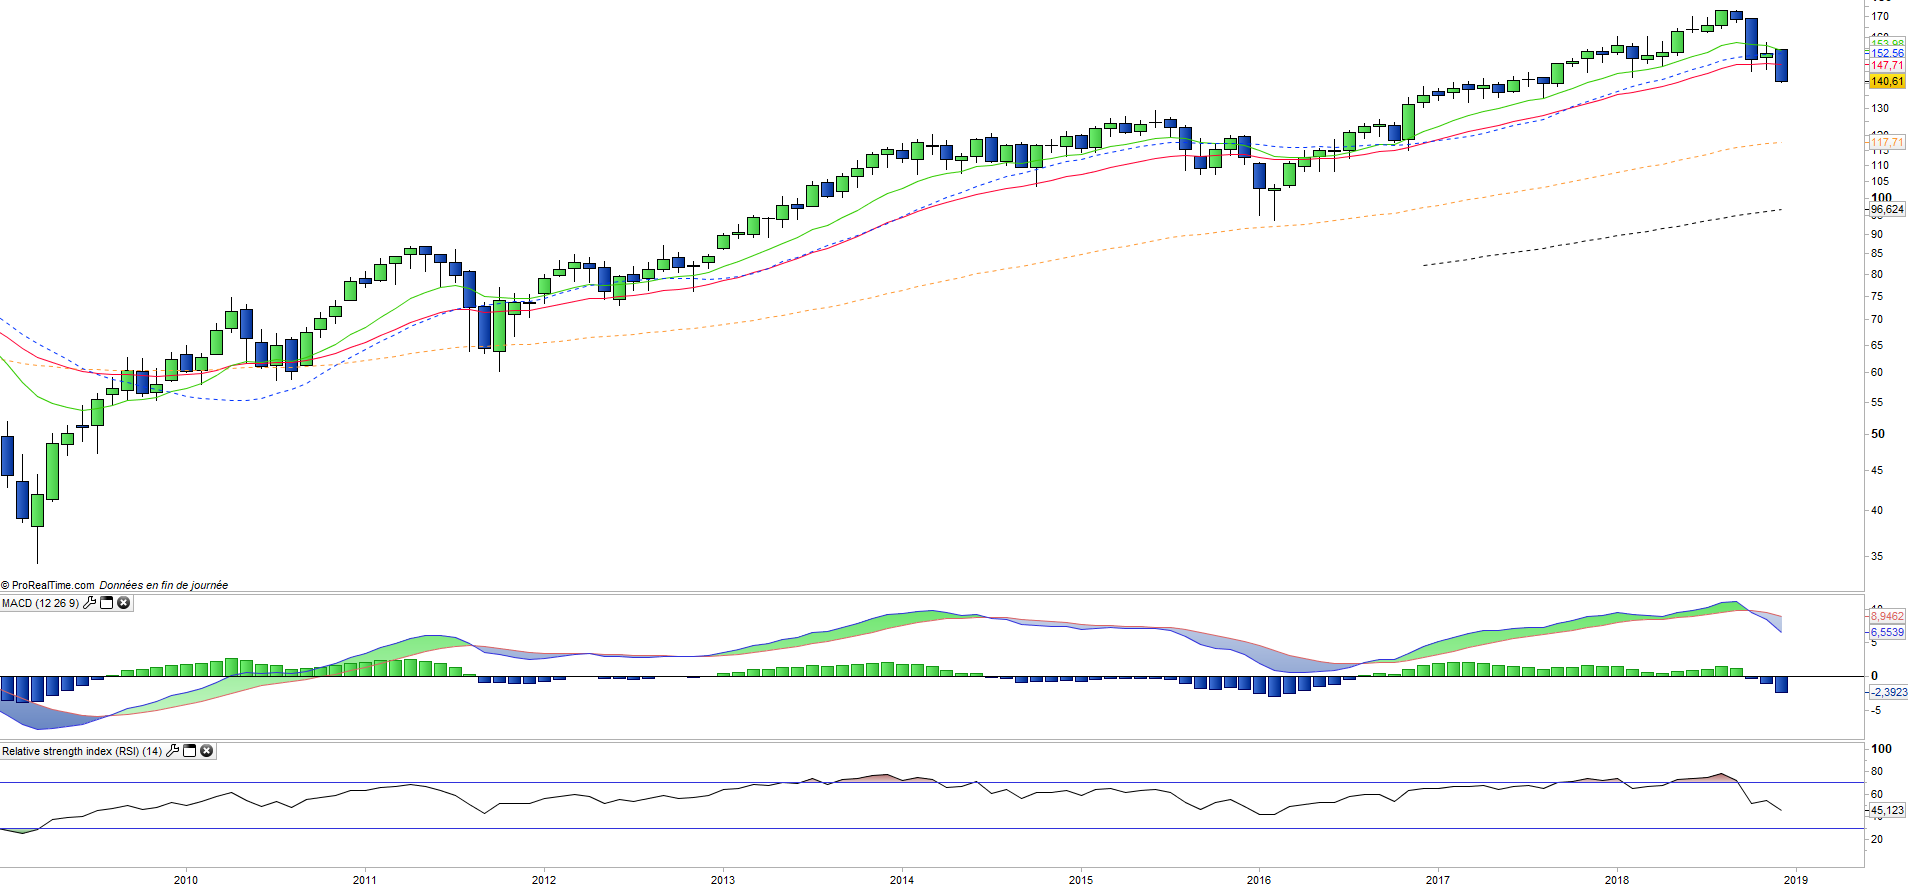
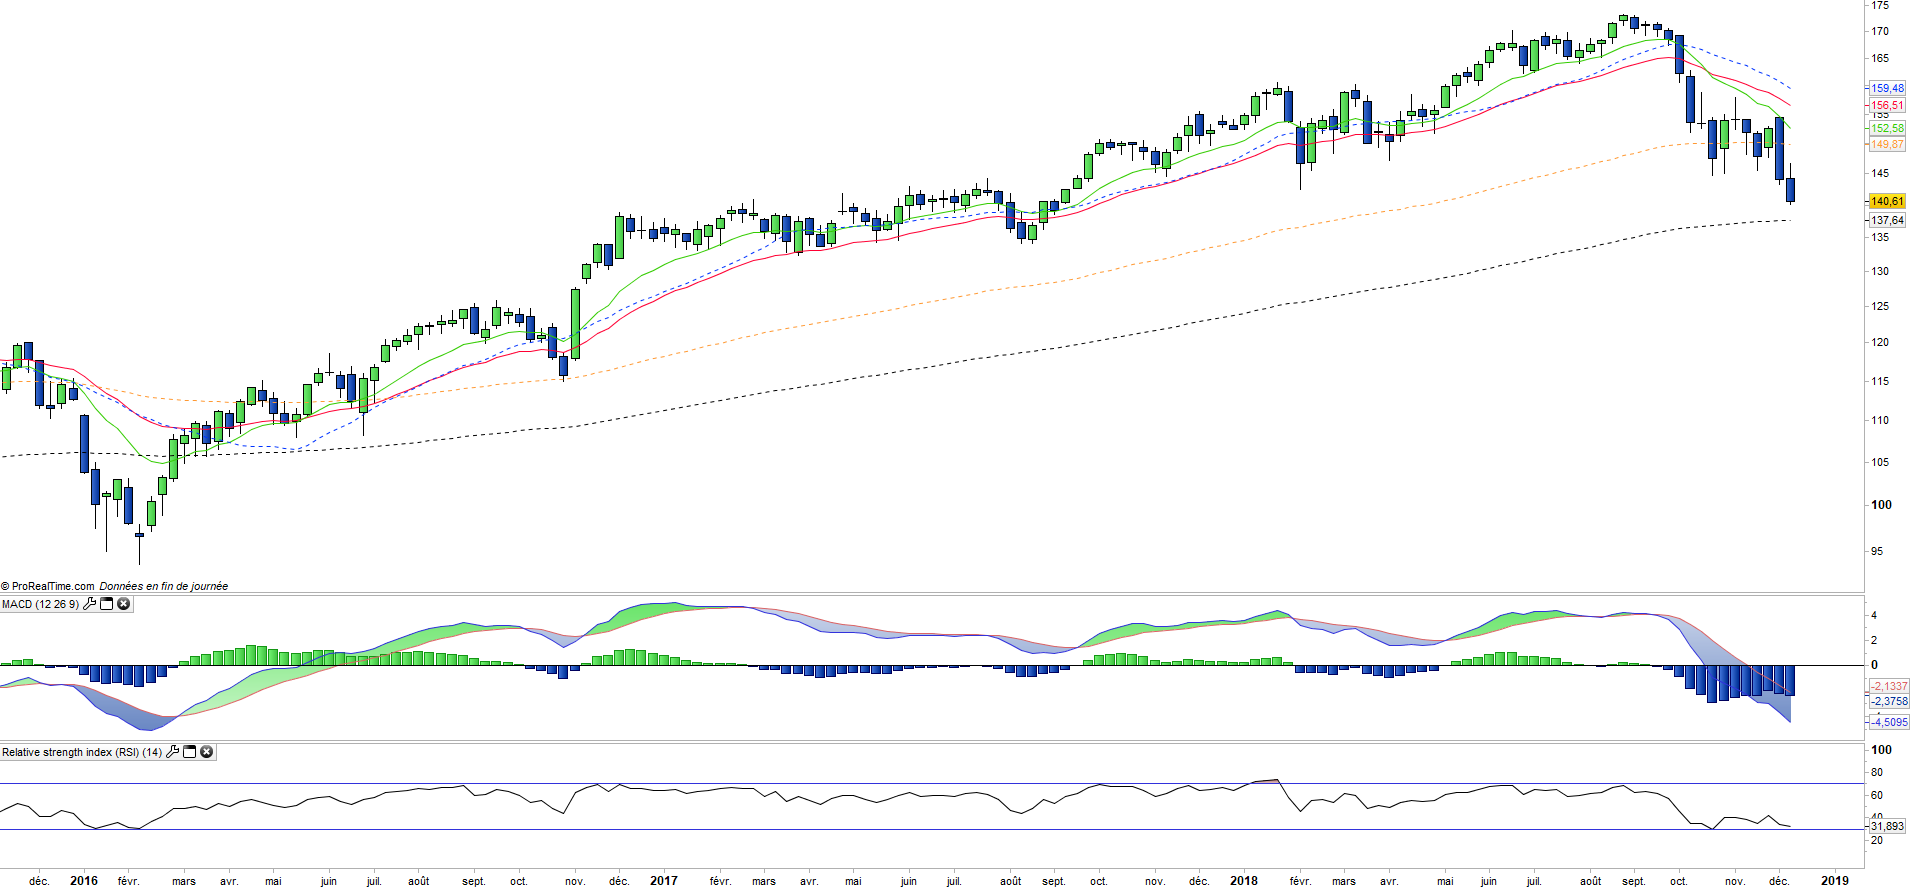
The Russell 2000 is down -7.8% since the beginning of the year (against -2.8% for the S & P500), after a rise of 13% in 2017 (against + 19.4% for the S & P500).
Russell 2000 is currently the weakest index in the US market, which confirms investors' risk aversion. The downtrend on the Russell2000 is often a leading indicator of the overall fall in the US indexes of large stocks, particularly expectations of a decline in growth or even a recession with a more pronounced impact on the growth theme.
Markets seem to be once again favoring so-called "value" themes offering dividends and a certain security of cash-flows such as Utilities or Telecoms rather than stocks offering high growth potential coupled with demanding multiples. The average P / E of the index is currently at 16x the 12-month forward results versus 16x for the S & P500, which remains acceptable unless the earnings momentum weakens or turns around. The investment on the Russell 2000 is therefore a bet on the US GDP growth in 2019, on which the risks accumulate in recent months due to the trade war between China and the US.