Lyxor Emerging Markets (LEM) - 04/03/19
Short Term strategy: Positive (90%) / Trend -
Long Term strategy: Positive (90%) / Trend =
Characteristics of the ETF
The Lyxor LEM ETF (UCITS), created in 04/2007 in Euro on Euronext and replicates the MSCI Emerging Markets Net Total Return Index.
The values of the MSCI Emerging Markets Net Total Return Index are selected to represent 85% of the market capitalization of the Emerging Markets zone, while reflecting the economic diversity of this market. It is a global index of 1124 stocks, with 27% of the capitalization coming from China.
The fee of this ETF is 0.55% and the AUM is approximately € 1490M. The replication method is indirect (via a swap) and there is a dividend capitalization method.
Alternative ETFs: EEM (iShares in USD), EMEA (Amundi in EURO)
Latest developments
In 2017, the index achieved a performance of 20.9% but corrected by 10.5% in 2018. Since the beginning of the year the index of emerging markets is rebounding and recorded an increase of 8.4%.
The Latin American countries dampened the shock of the index at the end of the year, due to the elections in Brazil of Mr Bolsonaro which provoked a positive momentum on in Brazil and on the whole Latam markets. Meanwhile, the Asian indices have flinched due to increased tensions between China and the US, but bounced strongly from early this year while an agreement seems at hand. The failed summit between D.Trump and Kim in Hanoi weighed a bit on the Asian zone last week, but the discussions do not seem to be interrupted for the moment.
The Latin America zone has begun a correction in recent days, which seems linked to the relative rise of the US dollar against the Brazilian real and the rise of US long term rates. The emerging countries index remains closely linked to the evolution of the Chinese economy and the Asia zone.
Index & components
The ETF LEM replicates a broad index composed of 1124 stocks from 28 countries.
The most represented zone is Asia with 70% of the capitalization of the index of which 28% for China, 14% for South Korea and 8% for India. The major South American, African and Middle Eastern economies are represented in the index by market capitalization.
The two main sectors are technology (15% of the index) and financials (24%).
The top 10 stocks in the index represent only 21% of the index's capitalization (Tencent is the first capitalization with 4,7%) and the specific risk is therefore quite low.
Emerging countries may be correlated in their stock market evolution, however there are also opposite rationales. For example, a good number of African countries, the Middle East or South America are linked to oil prices while India has an inverse correlation because it exports almost all of its energy.
Global growth is now led by emerging countries, which account for nearly 40% of global GDP, with India (7% growth) and China (6%) leading the way. These two emerging giants are respectively 5th and 2nd world economies in 2018. Next to these two major economies, which together account for 40% of the world's population, a number of major emerging economies such as Brazil, Turkey or Mexico have more chaotic paths because of political problems (Turkey, Brazil) or specific problems, like Mexico in negotiation with the US on trade agreements (looks well in process).
Emerging countries are much stronger financially and economically than they were 20 years ago during the 1998 crisis, and often have lower debt and smaller fiscal imbalances than developed countries due to less generous social systems and more dynamic demography.
Weekly data

The weekly chart shows a medium-term trend that is once again bullish but seems to have hit a short-term high. The structure that formed last week is a bearish engulfing that pleads for a continuation of the decline in the coming days. The EMAs13 & 26 should play their support role and allow a rebound, or even a continuation of the rise in the coming weeks.
Daily data
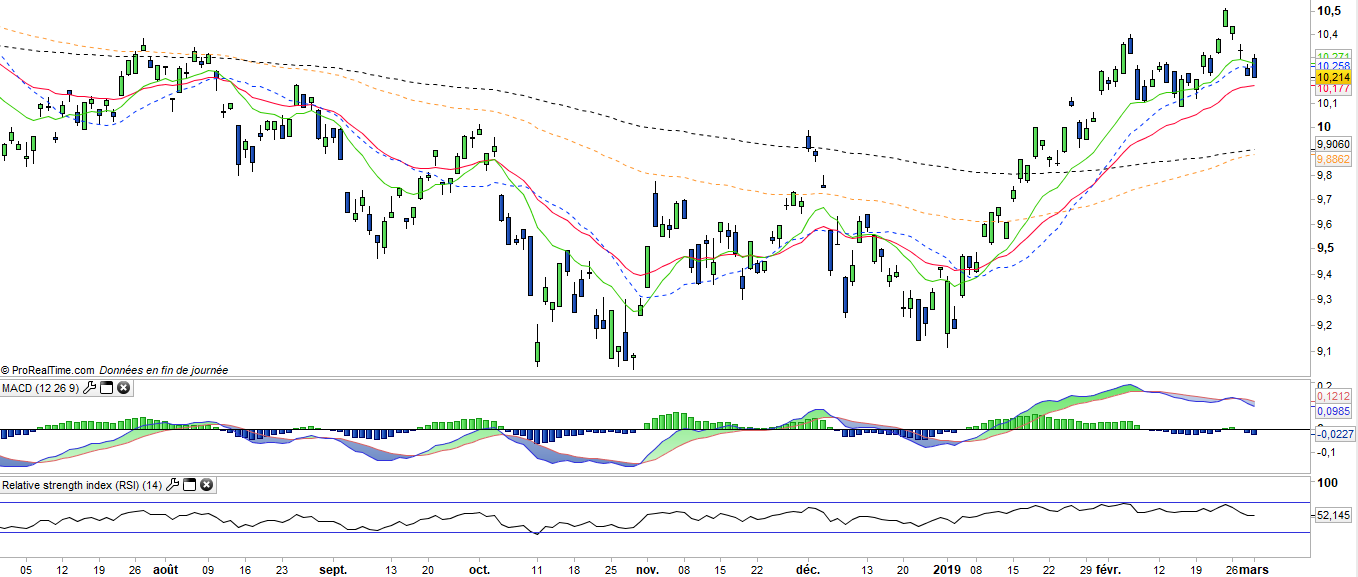
The daily chart shows a short-term bullish structure in short-term consolidation phase, with a potentially double-top structure that risks having a bearish influence for some time in case of crossing the 10 € neck line. At this point EMAs13 and 26 remain well oriented, but the correction could continue for a while while waiting for a new upward momentum.
Theme
LEM is a UCITS ETF, listed in €, which seeks to replicate the MSCI Emerging Markets Net Total Return index (1124 emerging countries companies)
Characteristics
| Inception date | 18/04/2007 |
| Issuer | Lyxor |
| Expense ratio | 0,55% |
| Benchmark | MSCI Emerging Markets Net Total Return index |
| Ticker | LEM |
| ISIN | FR0010429068 |
| UCITS | Yes |
| EU-SD Status | Out of scope |
| Currency | € |
| Exchange | Euronext Paris |
| Assets Under Management | 1 490 M€ |
| Replication Method | Indirect (swap) |
| Dividend | Capitalization |
| PEA (France) | No |
| SRD (France) | Yes |
| Currency Risk | Yes |
| Number of Holdings | 1 124 |
| Risk | 4/5 |
Country Breakdown
| China | 28% |
| South Kore | 14% |
| Taiwan | 11% |
| India | 8% |
| Brazil | 8% |
| South Africa | 6% |
| Hong Kong | 4% |
| Russia | 4% |
| Others | 18% |
Sector Breakdown
| Financials | 25% |
| Information technology | 15% |
| Communication services | 14% |
| Consumer discretionary | 12% |
| Energy | 8% |
| Materials | 8% |
| Consumer staples | 6% |
| Others | 14% |
Top Ten Holdings
| Tencent | 5% |
| Alibaba Group | 5% |
| Samsung Electronics | 4% |
| Taiwan semiconductor | 4% |
| Naspers | 2% |
| China Construction Bank | 2% |
| China Mobile | 1% |
| Ind & Comm Bank of China | 1% |
| Ping an Insurance Group | 1% |
| Reliance Industries | 1% |