Lyxor Emerging Markets (LEM) - 21/01/19
Short Term strategy: Positive (70%) / Trend +
Long Term strategy: Positive (60%) / Trend +
Characteristics of the ETF
The Lyxor LEM ETF (UCITS), created in 04/2007 in Euro on Euronext and replicates the MSCI Emerging Markets Net Total Return Index. The values of the MSCI Emerging Markets Net Total Return Index are selected to represent 85% of the market capitalization of the Emerging Markets zone, while reflecting the economic diversity of this market. It is a global index of 1123 stocks, with 26% of the capitalization coming from China.
The fee of this ETF is 0.55% and the AUM is approximately € 1360M. The replication method is indirect (via a swap) and there is a dividend capitalization method.
Alternative ETFs: EEM (iShares in USD), EMEA (Amundi in EURO)
Latest developments
In 2017, the index posted a performance of 20.9% but declined by -10.5% in 2018. Since the beginning of the year the Emerging Markets Index has rebounded and is up 6.1%.
The strong pressure on emerging markets at the end of the year was mainly related to Asia in general and China in particular, because of the trade war with the US which has a strong impact on the 2nd world economy which depends heavily on imports. Trade agreement hopes fueled the rebound earlier this year, as China and the US gave themselves 90 days to reach an agreement.
At the same time Latin America (about 13% of the index) has recovered significantly since the autumn, which corresponds to the Brazilian elections and the hopes of improving the economy that accompany it.
The decline in US long-term rates in recent weeks and the stabilization of the dollar are positive factors for the attractiveness of emerging countries.
Index & components
The ETF LEM replicates a broad index composed of 1123 stocks from 28 countries.
The most represented zone is Asia with 70% of the capitalization of the index of which 26% for China, 14% for South Korea and 9% for India. The major South American, African and Middle Eastern economies are represented in the index by market capitalization. The two main sectors are technology (14% of the index) and financials (24%).
The top 10 stocks in the index represent only 21% of the index's capitalization (Tencent is the first capitalization with 4,8%) and the specific risk is therefore quite low. Emerging countries may be correlated in their stock market evolution, however there are also opposite rationales. For example, a good number of African countries, the Middle East or South America are linked to oil prices while India has an inverse correlation because it exports almost all of its energy.
Global growth is now led by emerging countries, which account for nearly 40% of global GDP, with India (7% growth) and China (6%) leading the way. These two emerging giants are respectively 5th and 2nd world economies in 2018. Next to these two major economies, which together account for 40% of the world's population, a number of major emerging economies such as Brazil, Turkey or Mexico have more chaotic paths because of political problems (Turkey, Brazil) or specific problems, like Mexico in negotiation with the US on trade agreements (looks well in process).
Emerging countries are much stronger financially and economically than they were 20 years ago during the 1998 crisis, and often have lower debt and smaller fiscal imbalances than developed countries due to less generous social systems and more dynamic demography.
Weekly data
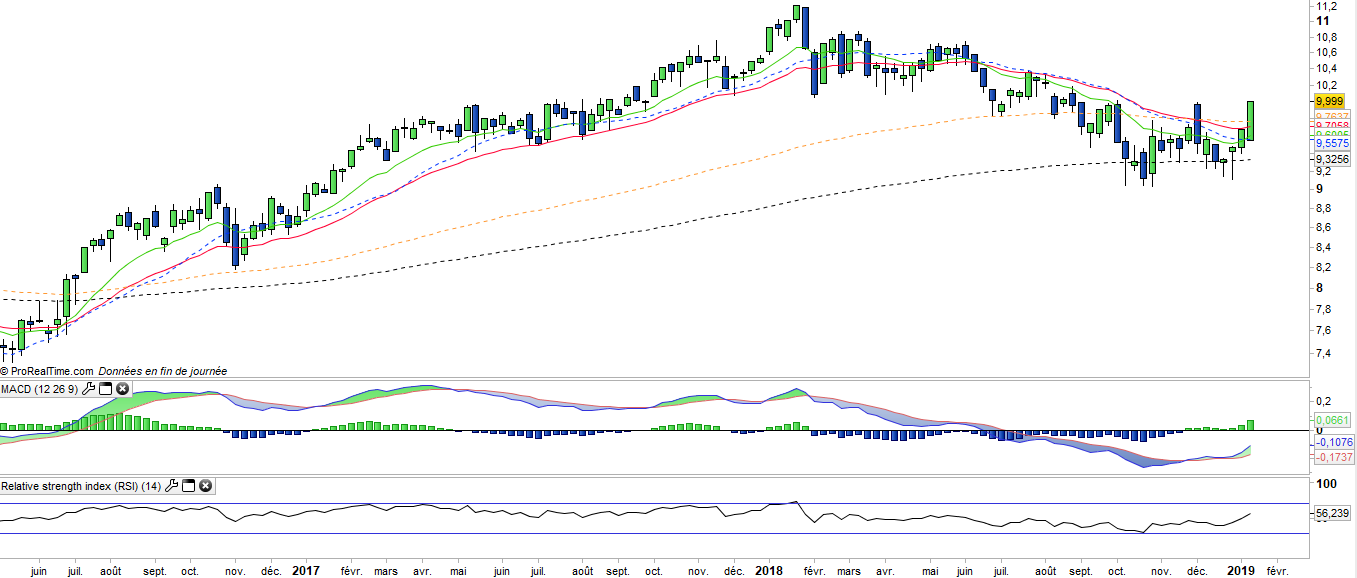
The weekly chart shows a double-bottom figure (W) with the € 10 neck line about to be crossed, which would open a target in the € 11 zone. The prices have crossed all the moving averages upward and the oscillators also reversed up. The reversal remains to be confirmed by the bullish breakout of the neck line and the EMAS13 & 26 crossing.
Daily data
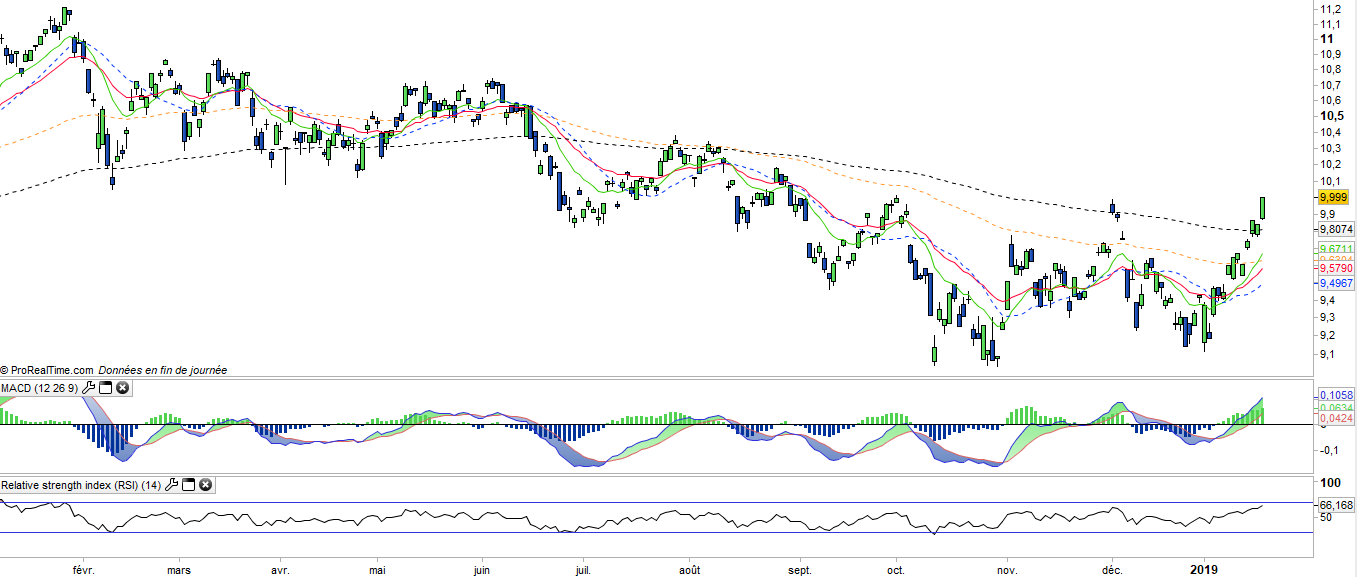
The daily chart shows an upward wave over a short-term horizon, which allowed the index to cross up both the short-term (EMAs13 & 26) and long-term (EMAs100 and 200) moving averages over the long term in some days. The movement is powerful and the breakout of the bearish line suggests a return to the peak in the coming weeks.
Theme
LEM is a UCITS ETF, listed in €, which seeks to replicate the MSCI Emerging Markets Net Total Return index (1123 emerging countries companies)
Characteristics
| Inception date | 18/04/2007 |
| Issuer | Lyxor |
| Expense ratio | 0,55% |
| Benchmark | MSCI Emerging Markets Net Total Return index |
| Ticker | LEM |
| ISIN | FR0010429068 |
| UCITS | Yes |
| EU-SD Status | Out of scope |
| Currency | € |
| Exchange | Euronext Paris |
| Assets Under Management | 1 319 M€ |
| Replication Method | Indirect (via a swap) |
| Dividend | Capitalization |
| PEA (France) | No |
| SRD (France) | Yes |
| Currency risk | Yes |
| Number of Holdings | 1 123 |
| Risk | 4/5 |
Country Breakdown
| China | 26% |
| South Kore | 14% |
| Taiwan | 11% |
| India | 9% |
| Brasil | 8% |
| South Africa | 6% |
| Hong Kong | 4% |
| Russia | 4% |
| Others | 18% |
Sector Breakdown
| Financials | 25% |
| Information Technology | 15% |
| Communication Services | 12% |
| Consumer discretionary | 11% |
| Energy | 8% |
| Materials | 8% |
| Consumer Staples | 7% |
| Others | 15% |
Top Ten Holdings
| Tencent | 5% |
| Samsung Electronics | 4% |
| Alibaba Group | 4% |
| Taiwan semiconductor | 3% |
| Naspers | 2% |
| China Construction Bank | 2% |
| China Mobile | 1% |
| Ind & Comm Bank of China | 1% |
| Itau Unibanco Holding | 1% |
| Baidu.com | 1% |