Lyxor stoxx 600 Net Return (SXXR) - 04/09/19
Short Term trend: Positive (85/100)
Long Term trend: Positive (95/100)
scores computed by our proprietary algorithms - cf methodology
indice profile
The MEUD (Lyxor) tracker replicates the European benchmark, which enjoys a very important depth with 600 holdings and a great diversity by its exposure to the main sectors and countries of the European Union, including outside of the eurozone.
This index is a benchmark for the European markets, and we analyze its stock market behavior with great attention because the evolution of this index partly conditions our sectoral and geographic strategy.
The index is fairly balanced in its weighting with 4 major sectors that represent two thirds of the capitalization. In the first position is the cyclical and sustainable consumer goods sector (24%), which includes food giants such as Nestlé or AB-Inbev, as well as luxury, cosmetics and ready-to-wear brands like LVMH or Inditex as well as the automotive sector; financial (17%) industry (14%) and health (14%). In this index, energy-related values represent only 6% and raw materials 8%.
In addition, it should be noted that there is a certain level of currency risk in this index consisting of 24% of British securities and 15% of Swiss securities, even if the securities concerned are international and fairly exposed to the dollar.
The STOXX600 is very representative of the European economy because of its sector weighting, which is less favorable to oil than in some national indices (like the CAC40), while the financial sector (banks + insurance) remains a key compartment with 10% of the weighting but without reaching the weight of the Italian or Spanish indices (c.30%). This balanced weighting allows MEUD to have lower volatility than the national indices, as this index is much more diversified and without sector bias.
The ETF MEUD has the advantage of replicating a broader index than the Eurostoxx50 and which also incorporates smaller capitalizations, but with a more dynamic path. The European economic cycle is currently weakening, which is validated both by the PMIs datas and also Germany at the hedge of a recession. The ECB remains a factor of stabilization and the monetary normalization should be very progressive in the absence of inflation.
Instruments : MEUD (Lyxor), C6E (Amundi in Euro), ETZ (BNP Paribas Easy in Euro), EXSA (iShares in Euro)
Technical analysis
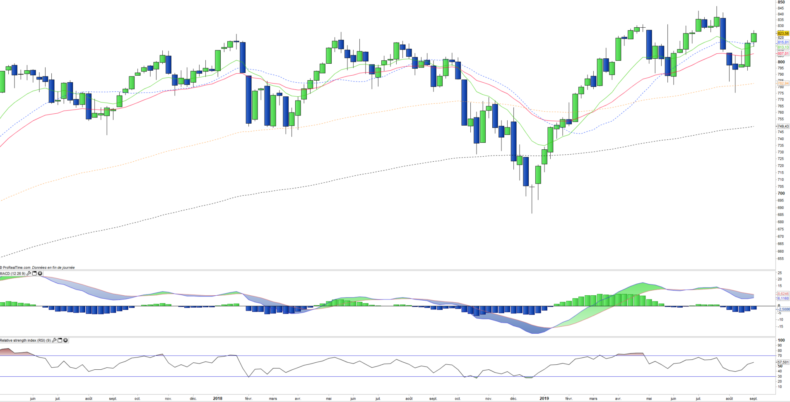
Weekly data analysis
The weekly chart shows a typical bullish reaction on the major support represented by the MME100. The prices are ironed this week above the set of moving averages, which causes a start of reversal of technical oscillators. This rebound is characteristic of the current period of range, where any bullish or bearish attempt systematically haunts the limits of the congestion zone. Markets remain quite volatile but not directional.
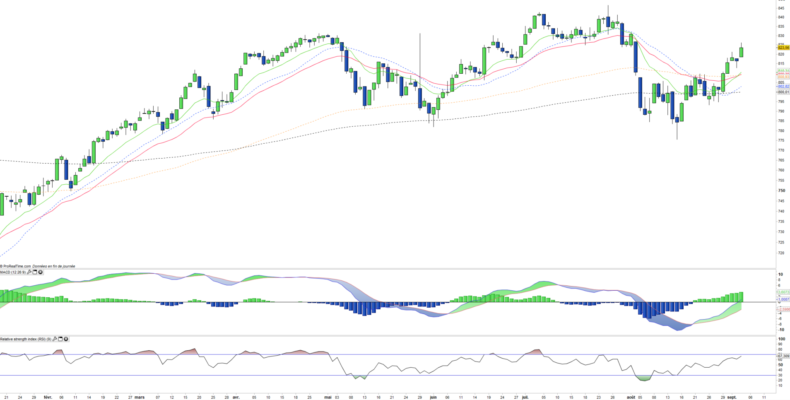
Daily data analysis
On the daily chart, we can see a short-term rebound that again commits to the ceiling of 840 pts which corresponds to the resistance of the trading range. The credibility of the rebound is reinforced by the return of prices above the EMA20 and the bullish formation in formation on EMAs12 and 26. The oscillators also turned upward. However, the index evolving inside a trading range, this positive reversal as well as its residual potential are to put into perspective.
Country breakdown
| United Kingdom | 23% |
| France | 17% |
| Switzerland | 16% |
| Germany | 14% |
| Netherlands | 7% |
| Spain | 4% |
| Sweden | 4% |
| Others | 15% |
Sector breakdown
| Financials | 17% |
| Consumer staples | 15% |
| Healthcare | 14% |
| Industrials | 14% |
| Consumer discretionary | 9% |
| Materials | 8% |
| Energy | 6% |
| Others | 17% |
Top Ten holdings
| Nestlé | 4% |
| Novartis | 3% |
| Roche Holding | 2% |
| HSBC | 2% |
| SAP | 1% |
| Total | 1% |
| Royal Dutch Shell | 1% |
| BP PLC | 1% |
| LVMH | 1% |
| Astrazeneca | 1% |


