Lyxor stoxx 600 Net Return (MEUD) - 10/09/2018
Short Term strategy: Negative (30%) / Trend -
Long Term strategy: Positive (80%) / Trend -
Characteristics of the ETF
The MEUD ETF (Lyxor) created in 04/2013 replicates the STOXX600 Net Return index which is composed of the 600 largest European stocks representative of the main sectors, while the stocks of the Euro zone represent approximately 53% of the index, there is therefore a significant exposure to other European currencies, in particular the British Pound and the Swiss Franc.
The fees of the ETF MEUD are quite low at 0.07% and the AUM is €1487M. Replication is direct (physical) and there is a dividend capitalization policy.
Alternative ETFs: C6E (Amundi in Euro), ETZ (BNP Paribas Easym in Euro), EXSA (iShares in Euro)
Latest developments
The Stoxx600NR finished the year 2017 on a rise of 10.6% justified by the double-digit increase of the corporate results.
The year 2018 is reflected for the moment by a slight drop in the index (-1.6%), which is linked to concerns about the US-led trade war that could directly impact key sectors like the automotive or the pharmacy and which destabilizes more and more the emerging countries on which depends the growth of many sectors of activity.
The political uncertainties are also increasing with an Italian government that worries the markets by striving to get rid of Brussels and an ever more uncertain Brexit. The economic cycle remains well oriented for the moment, but the risks are sharply increasing, with increasing volatility factors due to the "Trump factor".
The bright spot remains the quality of the expected corporate earnings up 8-10% this year while valuations remain reasonable at around 15x current earnings. The current risk is more of a risk of increased volatility than a risk of recession that seems low given the accommodating policy of central banks.
Index & components
The MEUD (Lyxor) tracker replicates the European benchmark, which enjoys a very important depth with 600 holdings and a great diversity by its exposure to the main sectors and countries of the European Union, including outside of the eurozone.
This index is a benchmark for the European markets, and we analyze its stock market behavior with great attention because the evolution of this index partly conditions our sectoral and geographic strategy.
The index is fairly balanced in its weighting with 4 major sectors that represent two thirds of the capitalization. In the first position is the cyclical and sustainable consumer goods sector (23.3%), which includes food giants such as Nestlé or AB-Inbev, as well as luxury, cosmetics and ready-to-wear brands like LVMH or Inditex as well as the automotive sector; financial (19.8%) industry (14.1%) and health (13,3%). In this index, energy-related values represent only 6.9% and raw materials 8.1%.
In addition, it should be noted that there is a certain level of currency risk in this index consisting of 24.8% of British securities and 12.8% of Swiss securities, even if the securities concerned are international and fairly exposed to the dollar.
The STOXX600 is very representative of the European economy because of its sector weighting, which is less favorable to oil than in some national indices (like the CAC40), while the financial sector (banks + insurance) remains a key compartment with c.20% of the weighting but without reaching the weight of the Italian or Spanish indices (c.33%). This balanced weighting allows MEUD to have lower volatility than the national indices, as this index is much more diversified and without sector bias.
The ETF MEUD has the advantage of replicating a broader index than the Eurostoxx50 and which also incorporates smaller capitalizations, but with a more dynamic path. The European economic cycle remains positive, which is validated both by the PMIs datas and also the results of companies above expectations in 2018. The ECB remains a factor of stabilization and the monetary normalization should be very progressive in the absence of inflation and despite the Bundesbank which would like a more restrictive policy, and the pressure linked to the rise in US long-term rates.
Monthly data
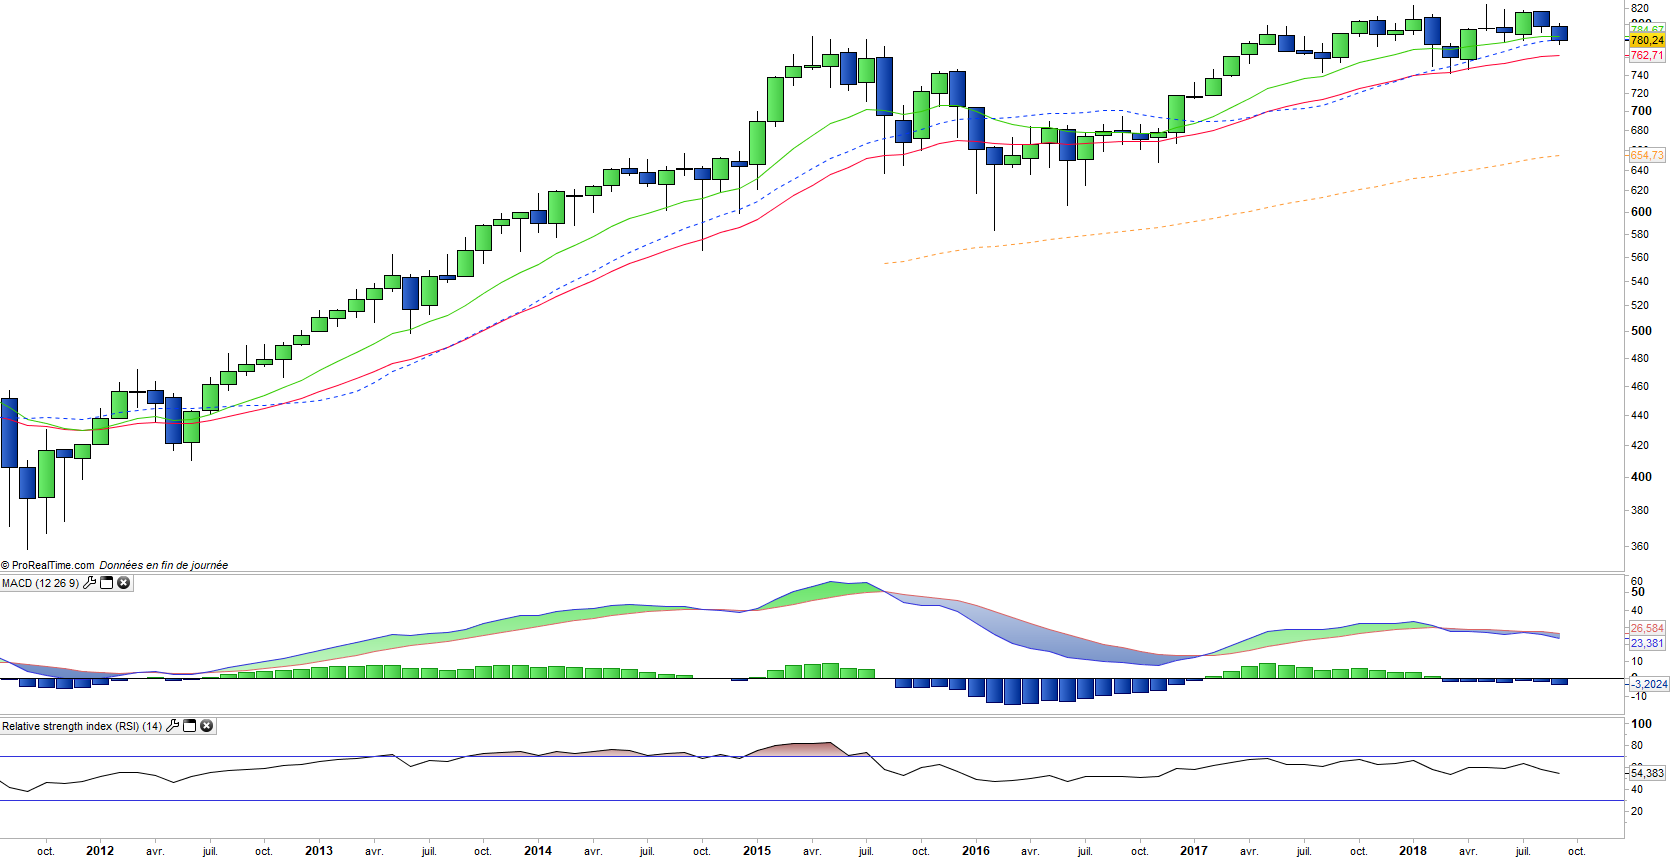
The monthly chart shows a trend that is running out of steam under the 820 pts resistance after several overtaking attempts. Oscillators show bearish divergences (quite marked on the RSI) which reinforces the risk of correction. Initially the prices should be stopped by the EMA26, but its depression could bode well for a long-term trend change for the first time since 2012.
Weekly data
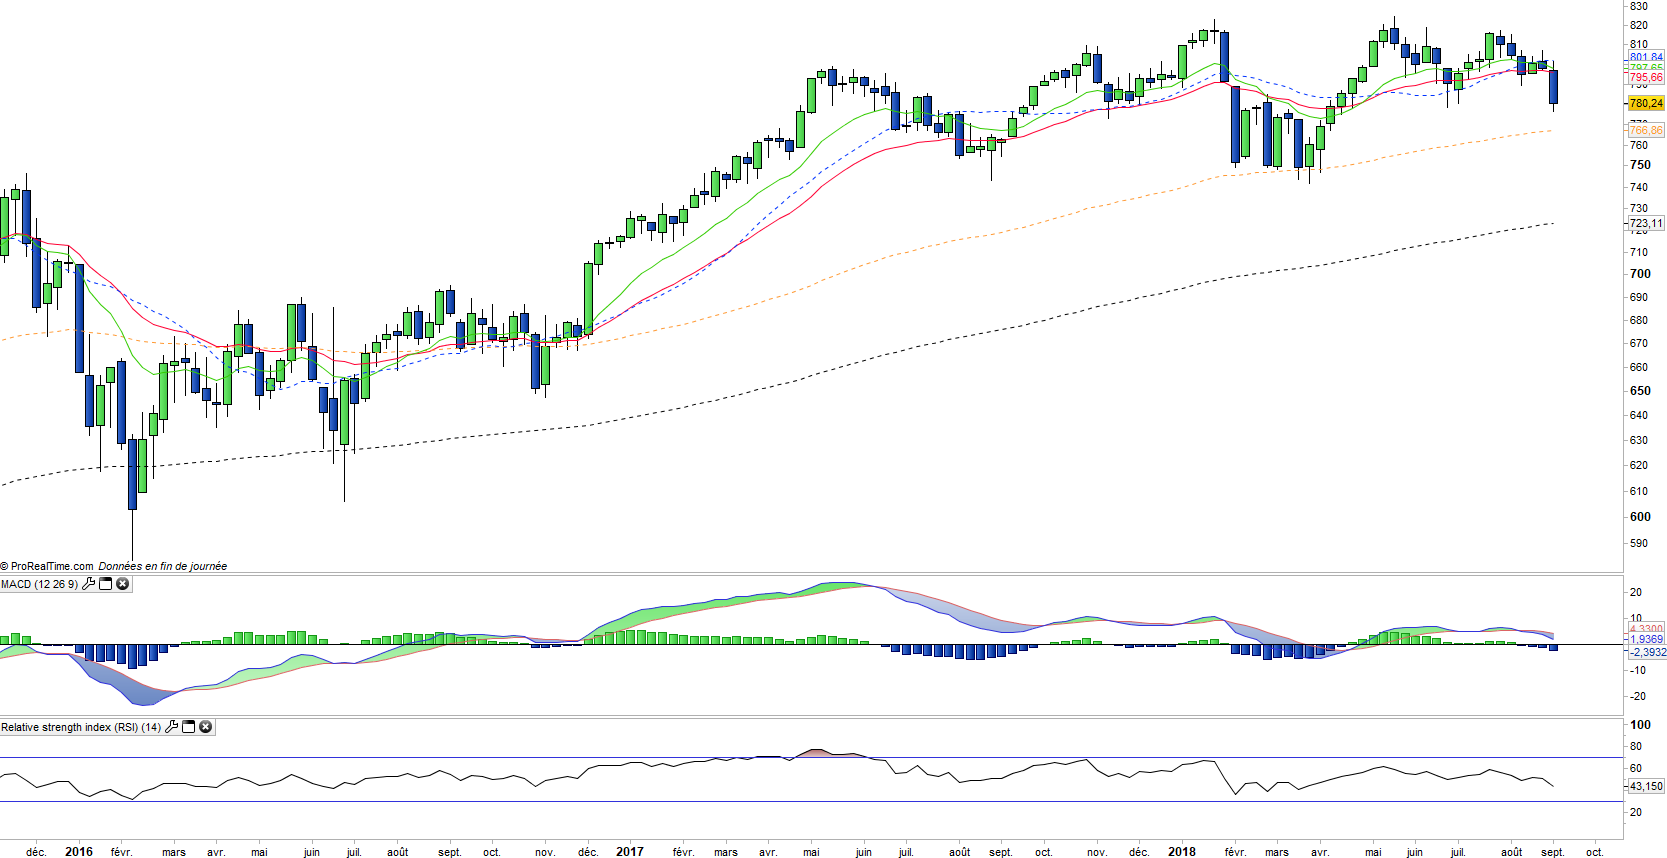
On the weekly chart, we can see the weakening of the medium-term trend, which could be reflected soon in the downward crossing of the EMAs13 and 26, while the oscillators have already turned down. The index is still protected by the EMA100 which constitutes the major resistance. In case of bearish breakout, the trading range 820/750 pts valid since March 2017 would be pushed down and would open a bearish potential of about 10%.
ETF Objective
MEUD is a UCITS ETF, listed in EUR, which seeks to replicate the Stoxx600 Europe index (600 companies)
Characteristics
| Inception dta | 03/04/2013 |
| Issuer | Lyxor |
| Expense ratio | 0,07% |
| Benchmark | Stoxx 600 |
| Ticker | MEUD |
| ISIN | LU0908500753 |
| UCITS | Yes |
| EU-SD Status | Out of scope |
| Currency | € |
| Exchange | Euronext Paris |
| Assets Under Management | 1 487 M€ |
| Replication Method | Direct (Physical) |
| Dividend | Capitalization |
| Currency Risk | Yes |
| Number of Holdings | 600 |
| Risk | 3/5 |
Country Breakdown
| United Kingdom | 25% |
| France | 17% |
| Germany | 15% |
| Switzerland | 14% |
| Netherlands | 6% |
| Spain | 5% |
| Sweden | 4% |
| Others | 14% |
Sector breakdown
| Financials | 20% |
| Industrials | 14% |
| Consumer Staples | 13% |
| Health Care | 13% |
| Consumer discretionary | 11% |
| Materials | 8% |
| Energy | 7% |
| Others | 15% |
Top Ten Holdings
| Nestlé | 3% |
| HSBC | 2% |
| Novartis | 2% |
| Royal Dutch Shell | 2% |
| Total | 2% |
| Roche Holding | 2% |
| BP | 2% |
| British American Tobacco | 1% |
| SAP | 1% |
| Siemens | 1% |