The Lyxor LEM ETF (UCITS), created in 04/2007 in Euro on Euronext and replicates the MSCI Emerging Markets Net Total Return Index. The values of the MSCI Emerging Markets Net Total Return Index are selected to represent 85% of the market capitalization of the Emerging Markets zone, while reflecting the economic diversity of this market. It is a global index of 1137 stocks, with 26% of the capitalization coming from China.
The fee of this ETF is 0.55% and the AUM is approximately € 1400M. The replication method is indirect (via a swap) and there is a dividend capitalization method.
Alternative ETFS: EEM (iShares in USD), EMEA (Amundi in EURO)
Index & components
The ETF LEM replicates a broad index composed of 1137 stocks from 28 countries.
The most represented zone is Asia with 63% of the capitalization of the index of which 26% for China, 14% for South Korea and 9% for India. The major South American, African and Middle Eastern economies are represented in the index by market capitalization.
The two main sectors are technology (28% of the index) and financials (23%). The top 10 stocks in the index represent only 25% of the index's capitalization (Tencent is the first capitalization with 4,7%) and the specific risk is therefore quite low.
Emerging countries may be correlated in their stock market evolution, however there are also opposite rationales. For example, a good number of African countries, the Middle East or South America are linked to oil prices while India has an inverse correlation because it exports almost all of its energy. Global growth is now led by emerging countries, which account for nearly 40% of global GDP, with India (7% growth) and China (6%) leading the way. These two emerging giants will be 5th and 2nd world economies in 2018. Next to these two major economies, which together account for 40% of the world's population, a number of major emerging economies such as Brazil, Turkey or Mexico have more chaotic paths because of political problems (Turkey, Brazil) or specific problems, like Mexico in full negotiation with the US on trade agreements.
Emerging countries are much stronger financially and economically than they were 20 years ago during the 1998 crisis, and often have lower debt and smaller fiscal imbalances than developed countries due to less generous social systems and more dynamic demography.
Latest developments
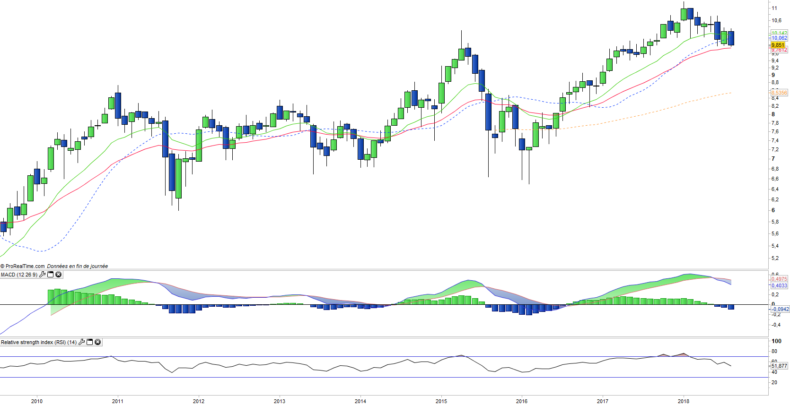
In 2017, the index achieved a performance of 20.9% and after a favorable start in January is down about 6.5% in 2018 due to a number of internal and exogenous factors.
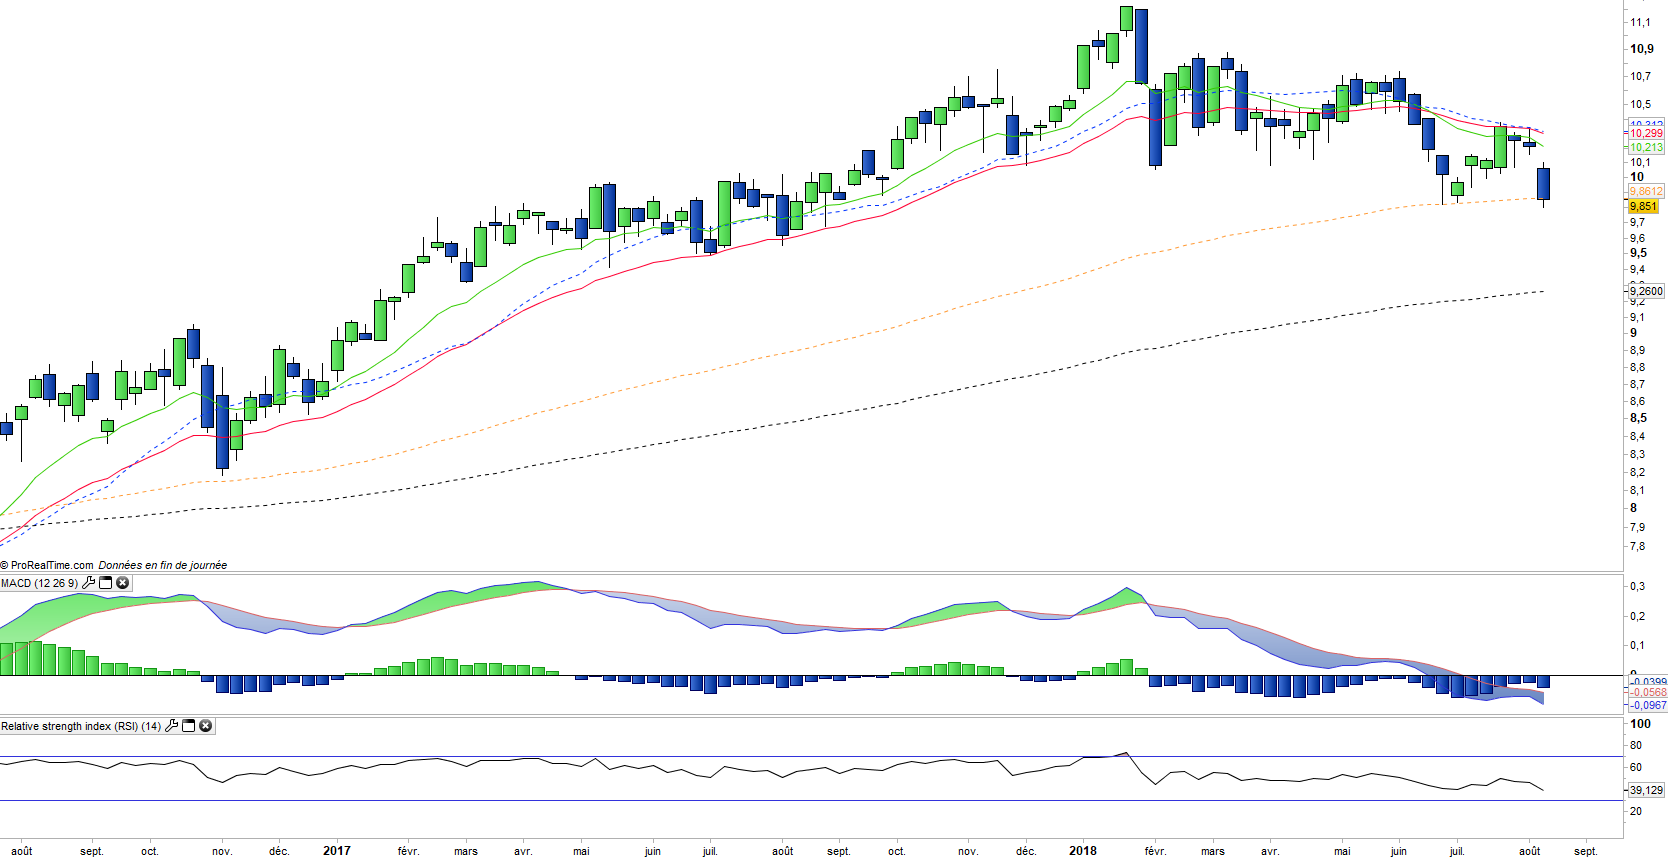
Many negative factors are accumulating in emerging countries, which is partly linked to D.Trump’s policy and his economic war, the strength of the USD and US long-term rates that make emerging countries relatively less attractive, but also the governance problems of a large number of countries, from Brazil to Turkey to South Africa.
The recent bearish acceleration is due to the Turkish crisis, while President Erdogan is pursuing an increasingly liberal and anti-Western policy and finds himself in a high-risk conflict with the US. The decline in the index is mainly driven by the currency but also by banks and is likely to spread to other emerging countries considered fragile, such as South Africa.
The major Asian emerging economies (China and India) are threatened by the increasingly protectionist trade policy of the US, which threatens global growth, and has the effect of driving up the dollar and interest rates, causing capital flight to the United States, which in turn should fuel inflation.