Lyxor ETF FTSE MIB - MIB - 08/12/2017
Short Term strategy : Positive (60%) / trend -
Long Term strategy : Positive (95%) / trend =
Characteristics of the ETF
The ETF MIB (Lyxor FTSE MIB40), quoted in Euro, replicates the Italian national index, composed of the 40 main Italian securities. The composition of the index is determined on the basis of three criteria: free float, liquidity and the representativeness of the main sectors of the Italian market.
The ETF MIB charges are 0.35%, in line with the average observed for these products and the AUM is approximately € 757M. Replication is indirect (via swap) and there is a dividend distribution policy. This ETF is eligible for PEA.
Alternative ETFS: EWI (iShares USD)
Index & components
This index has the particularity of being very overweight in financials, which represent more than one third (37.7%) of its composition (against around 20% for stoxx600), including Intesa San Paolo, Unicredit and Generali, while Energy is also a significant weight (15.3%) via ENI and Saipem, the second largest sector being utilities (15.9%), among which are Enel, SNAM and Atlantia. The 10 largest caps represent just over two-thirds of the index (67.9%).
The Italian index is very volatile, given the importance of cyclical and financial sectors and the structural weakness of the Italian economy due to lack of growth, high unemployment and huge debt (132% of GDP) which worries the markets regularly. The Italian economy has been hit hard by the financial crisis: it has contracted by more than 9% since 2007 and has faced 13 quarters of recession. Although the Italian economy has emerged from the recession since 2015, growth remains below the expectations of the Italian government and the euro area average.
In 2016 the country was hit by two earthquakes and the arrival of 170,000 migrants on its territory which led to a major humanitarian crisis. In December 2016, the Italian people voted "no" (59%) to constitutional reform in a referendum, prompting Prime Minister Matteo Renzi to resign. New elections are scheduled for 2018 (in the spring), while Mr Renzi has been re-elected as the leader of the Democratic Party, and slightly leads the poll ahead the 5-star protest movement.
Italy has made good progress in its banking restructuring in 2017 with the State's rescue of the Vénetes banks (in defiance of the European Banking Union rule) and the recovery of the assets by Intesa Sanpaolo, which followed the rescue of BMPS, as well as the refinancing of Unicredit for € 13bn in the first quarter of 2017. The French election has strengthened the euro zone, which directly benefits Italy whose growth is recovering quarter after quarter, pulled in the first place by exports, but according to the latest statistics, domestic consumption and investment take over.
Overall, structural factors (banking system reforms and labor flexibility) are taking shape, and the economic cycle is accelerating. The Euro / USD exchange rate remains a significant factor for the Italian economy driven by exports.
Latest developments
In 2017, the index is currently showing a sharp increase of 16% (against 9.7% for the stoxx600NR) which compensates for the fall of 10.2% in 2016 (against + 1.7% for the Stoxx600 ), due to Italian bank restructurings and political deadlines (referendum on institutions). Banks support the index since the beginning of the year (+ 22.1% for ISP and + 23.5% for UC) while the energy sector is misguided because of the fall in crude prices and weighs on the index (ENI: -8% and Saipem -36.9%).
On October 27, Standard & Poor's upgraded the Italian government debt rating from "BBB-" to "BBB" by one notch, and welcomed the improvement in the country's economy. It had been thirty-five years since the US rating agency had revised the Peninsular note upward.
GDP was revised up 1.5% in 2017, compared to 1% previously estimated, then 1.4% in 2018. Corporate morale is hitting a high, the business failure rate has fallen to 15, 6%, its lowest level since 2009, and exports grew 2.8% in the first eight months of the year. The growth is consolidating in Italy, supported by an acceleration of investments according to the ISTAT - the Italian statistical institute - The country will register for the third consecutive year a positive commercial balance. Unemployment remains at a high level, but retreats slightly with a rate of 11% in October 2017, after rising to 13% by the end of 2014. The elimination of Italy from the football world cup could, however, have a negative impact on the economy. Italian economic media estimate the shortfall for the Italian economy to about 10 billion euros, 0.5% of Italian GDP.
Monthly data
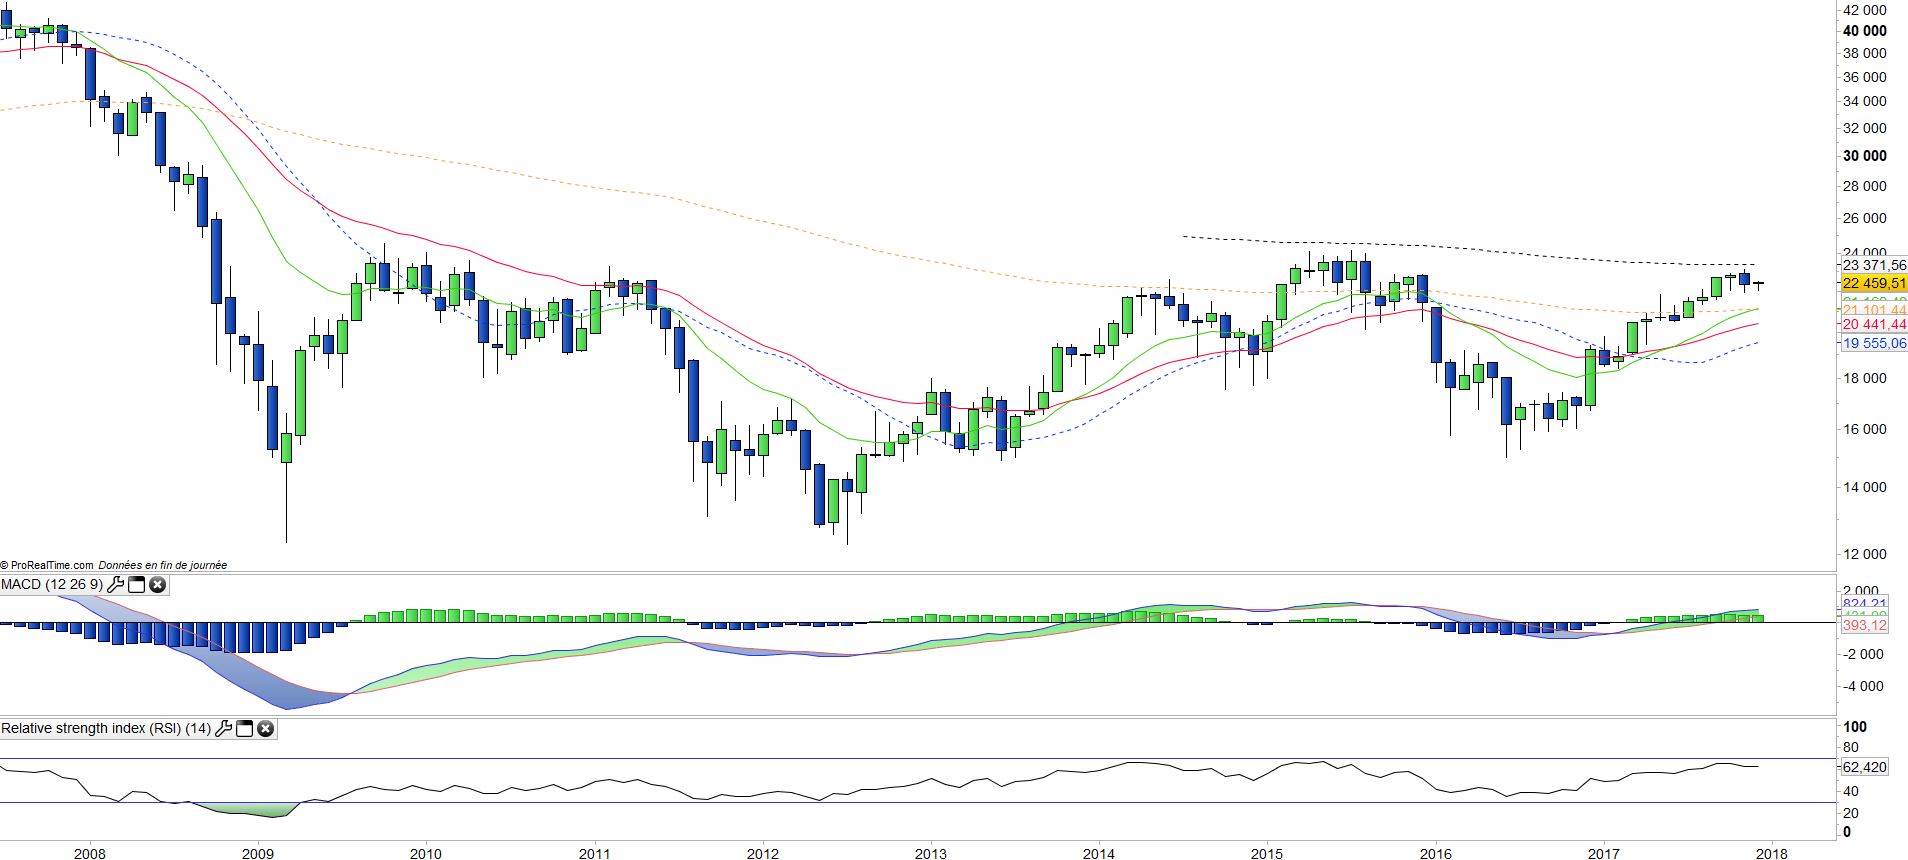
The monthly chart shows a long-term trend that remains bullish, with all indicators are positive and volatility rather lower than other European indices. Prices have tended to flatten out in recent months, like the banking sector. It would be more appropriate to talk about flat consolidation rather than a correction.
The first thing to remember is the relative strength of this index compared to the Stoxx600 which makes it a preferred medium.
Weekly data
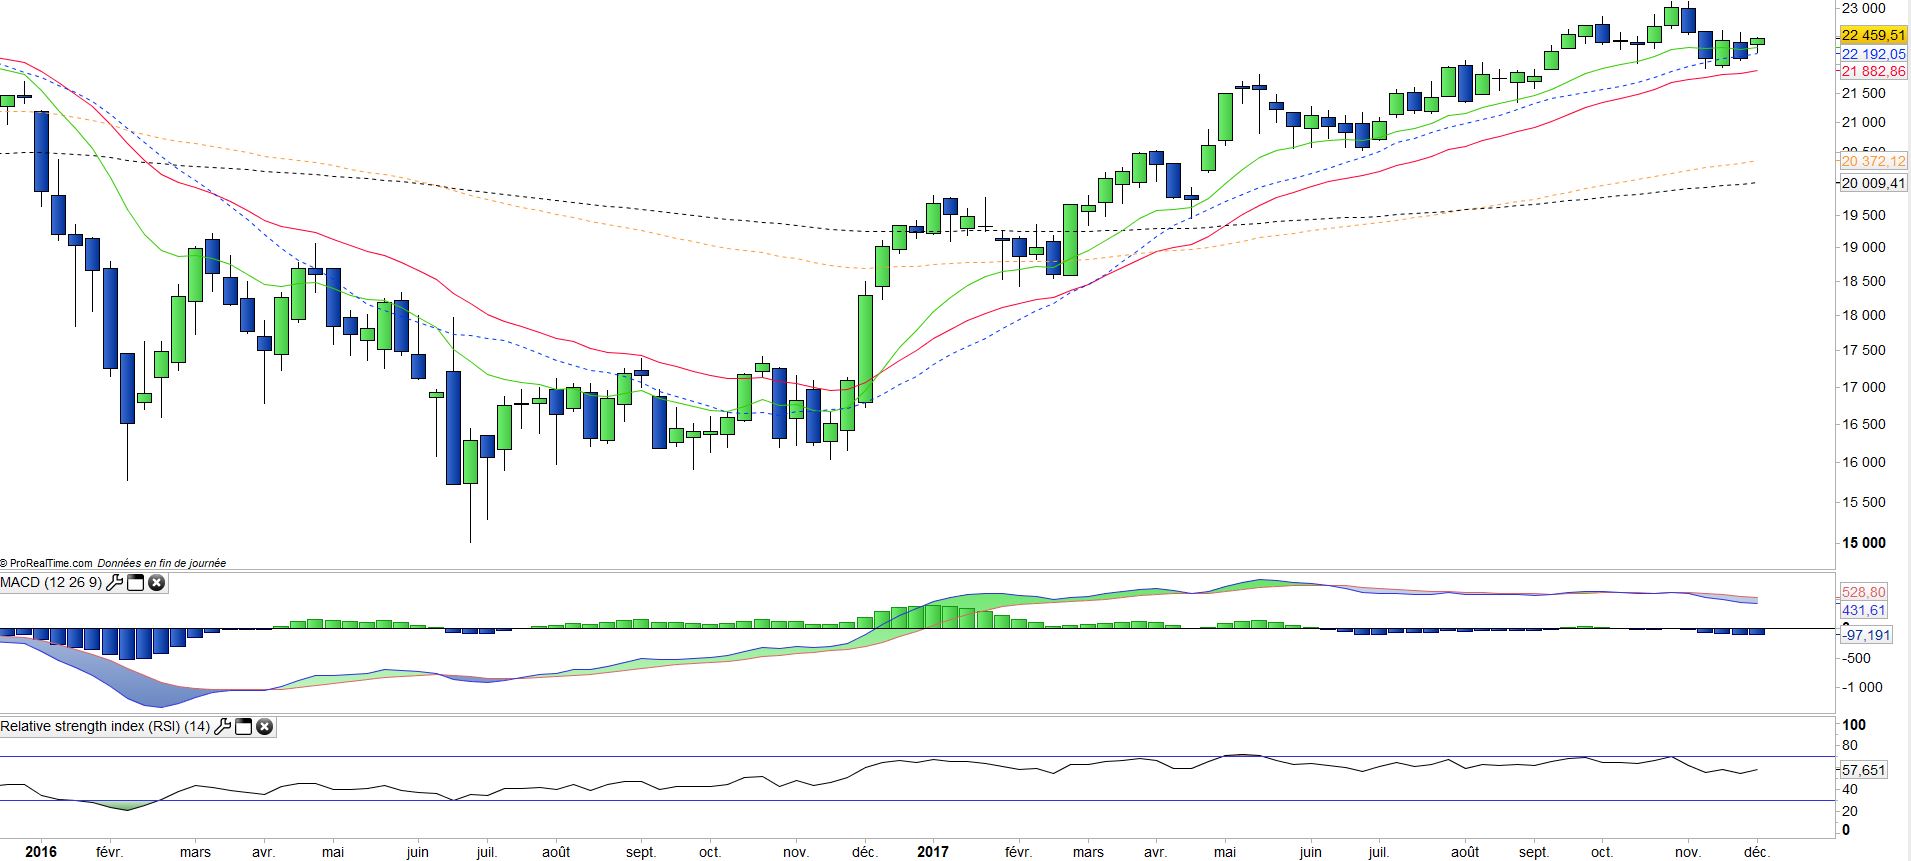
On the weekly chart, we can see that a correction is in progress within an uptrend but that it seems about to end. However, the flattening of oscillators and moving averages confirm a loss of momentum since the summer. A rebound must occur in the coming weeks for the index to maintain its bullish profile.
Objectifs de l’ETF
MIB is a UCITS ETF which replicates the FTSE MIB Net TR index (40 companies)
Caractéristiques
| Inception date | 04/11/2003 |
| Expense ratio | 0,35% |
| Benchmark | Indice FTSE MIB |
| Ticker | MIB |
| ISIN | FR0010010827 |
| UCITS | Yes |
| EU-SD status | Out of Scope |
| Currency | € |
| Exchange | Euronext Paris |
| PEA (France) | Yes |
| SRD (France) | Yes |
| Dividend | Distribution |
| Assets Under Management | 754 M€ |
| Currency Risk | No |
| Number of Holdings | 40 |
| Risk | 4/5 |
Country breakdown
| Italy | 87% |
| United Kingdom | 8% |
| Netherlands | 3% |
| Luxembourg | 2% |
Sector Breakdown
| Financials | 37% |
| Utilities | 16% |
| Energy | 15% |
| Consumer Discretionary | 13% |
| Industrials | 10% |
| Information Technology | 3% |
| Telecom Services | 2% |
| Others | 3% |
Top Ten holdings
| Enel | 12% |
| Unicredit | 11% |
| Intesa Sanpaolo | 10% |
| ENI | 10% |
| Assicurazioni Generali | 6% |
| Fiat Chrysler | 5% |
| Atlantia | 4% |
| Ferrari | 3% |
| STMicroelectronics | 3% |
| CNH Industrial | 3% |