Lyxor ETF FTSE MIB - MIB - 14/08/2018
Short Term strategy: Negative (0%) / trend -
Long Term strategy: Negative (30%) / trend -
Characteristics of the ETF
The ETF MIB (Lyxor FTSE MIB40) created in 11/2003, listed in Euro on Euronext, replicates the Italian national index, composed of the 40 main Italian securities. The composition of the index is determined on the basis of three criteria: free float, liquidity and the representativeness of the main sectors of the Italian market.
The ETF MIB charges are 0.35%, and the AUM is approximately €559M. Replication is indirect (via swap) and there is a dividend distribution policy.
Alternative ETFS: EWI (iShares USD), IMIB (iShares in Euro)
Index & components
This index has the particularity of being very overweight in financials which represent more than one third (36%) of its composition (against about 20% for the stoxx600), including Intesa San Paolo, Unicredit and Generali while the energy is also a significant weight (17,4%) via ENI and Saipem, the other important sectors are cyclical consumer goods (15%) and utilities (13.9%), among which are Enel , SNAM and Atlantia.
The 10 largest caps represent just over two-thirds of the index.
The Italian index is very volatile, given the importance of cyclical and financial sectors and the structural weakness of the Italian economy due to lack of growth, high unemployment and huge debt (134% of GDP) which worries the markets regularly.
The Italian economy has been hit hard by the financial crisis: it has contracted by more than 9% since 2007 and has faced 13 quarters of recession. Although the Italian economy has emerged from the recession since 2015, growth remains below the Italian government expectations and the euro area average. In 2016 the country was hit by two earthquakes and the arrival of 170,000 migrants on its territory which led to a major humanitarian crisis. Italy made good progress in its banking restructuring in 2017 with the rescue of state-owned banks and the takeover of assets by Intesa Sanpaolo, which followed the rescue of BMPS, as well as the refinancing of Unicredit for 13bn€ in the first quarter of 2017.
Overall, the structural factors (banking system reforms and labor flexibility) are taking shape, and the business cycle is accelerating. The election of a populist government fuels fears of a potential halt to reforms and a possible surge in the budget deficit.
The Euro / USD exchange rate remains a significant factor for the Italian economy driven by exports.
Latest developments
In 2017, the index posted an increase of 13.6% (against 10.6% for the stoxx600NR) and fell by -3.2% in 2018, which is mainly due to the banks (Unicredit and San Paolo fall by around 10 % since the beginning of the year), of which the fall is partially offset by the oil sector (ENI: + 18.5% and Saipem + 16.9%).
Although improving (GDP: + 1.4% in 2017), Italian growth has been revised downwards recently: + 1.3% instead of + 1.5% in 2018 and + 1% instead of + 1.2% in 2019 due to rising energy costs and a slowdown in manufacturing production. Moreover, Italian growth remains well below the European average (+ 2.1% in 2018e), which is due to its high level of indebtedness (134% of GDP) and unemployment, which remains high at around 11%.
The elections allowed a populist coalition to lead the government whose program is fearing a slippage of public finances as well as tensions with its European neighbors. Italy, however, should remain ungovernable and new elections are likely in 2019 or 2020. The crisis on the Turkish lira affecting European banks is a danger for the Italian index of which banks represent more than a third of the capitalization.
Monthly data

The monthly chart shows a monthly trend that is in endangered of reversal by a negative monthly candlestick in formation that has already depressed the EMA26 and caused the reversal of the MACD and major oscillators. The formation of a peak is quite clear and could cause an acceleration of the decline this summer towards 18 €.
Weekly data
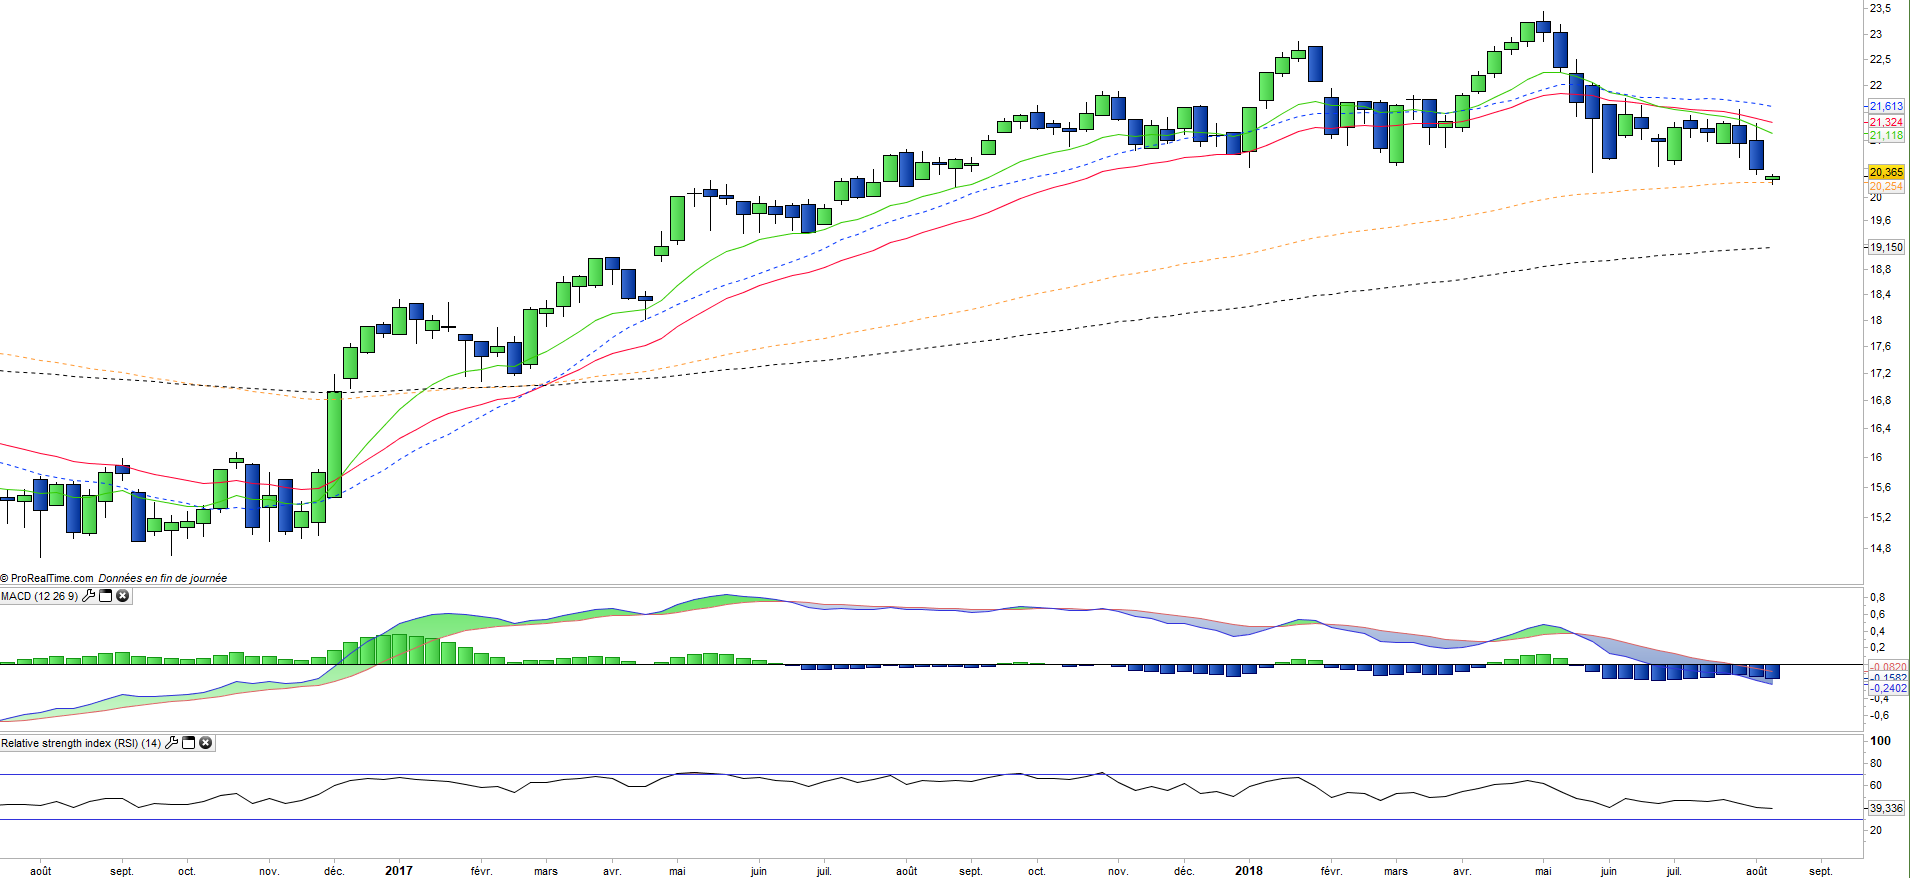
On the weekly chart, we can observe the development of a downtrend in the medium term. The trend has accelerated downward after the downward crossing of the EMAs13 and 26 and has just crossed a new milestone by crossing the EMA100 and is currently on the last support line, the EMA200. The round top structure is dangerous and does not bode well for the next few weeks.
ETF Objective
MIB is a UCITS ETF, listed in EUR, which seeks to replicate the FTSE MIB Net Total Return Index (40 italian companies)
Characteristics
| Inception date | 04/11/2003 |
| Expense ratio | 0,35% |
| Benchmark | Indice FTSE MIB |
| Ticker | MIB |
| ISIN | FR0010010827 |
| UCITS | Yes |
| EU-SD status | Out of scope |
| Currency | € |
| Exchange | Euronext Paris |
| PEA | Yes |
| SRD | Yes |
| Dividend | Distribution |
| Assets Under Management | 522 M€ |
| Currency risk | No |
| Number of holdings | 40 |
| Risk | 4/5 |
Country Breakdown
| Italy | 87% |
| United Kingdom | 8% |
| Netherlands | 4% |
| Luxemburg | 2% |
Sector Breakdown
| Financials | 36% |
| Energy | 18% |
| Consumer discretionary | 15% |
| Utilities | 14% |
| Industrials | 10% |
| Information technology | 4% |
| Telecom services | 2% |
| Others | 3% |
Top Ten Holdings
| ENI | 12% |
| Enel | 10% |
| Intesa Sanpaolo | 10% |
| Unicredit | 10% |
| Assicurazioni Generali | 6% |
| Fiat Chrysler | 5% |
| Atlantia | 4% |
| Ferrari | 4% |
| STMicroelectronics | 4% |
| CNH Industrial | 3% |