Lyxor Small Cap Europe (MMS) - 13/05/19
Short Term trend: Positive (80/100)
Long Term trend: Positive (95/100)
Scores computed by our proprietary algorithms - cf methodology
Characteristics of the ETF
The ETF MMS (Lyxor), listed in Euro, replicates the UCIT Small Cap Europe Index, which targets Eurozone companies whose market capitalization is between € 200 and € 1500m, ie companies that are ultimately more medium in size than microstructures.
The ETF charges are 0.4%, and the replication mode is direct, with AUM of approximately 219M€. The dividend distribution policy is carried out by distribution.
Alternative ETF: IEIS (iShares USD) SMAE (Lyxor EUR)
Index profile
The index replicated by the ETF includes 460 companies with wide sectoral and geographic diversification which makes it a broad and very diversified index.
The specific risk is low because the first 10 lines represent approximately 10% of the fund, or about 1% for the most important lines, including iconic growth stocks such as Rubis, Rheinmetall or Orpea.
The major economies (Germany, France and Italy) account for 52% of the selection, leaving a significant share for the Nordic economies such as Finland or the Benelux.
The Small Cap ETF represents an opportunity to play the growth of the euro area with a risk even below the benchmark index (stoxx600) - due to the absence of large banks - a policy of dividend distribution and with a much more assumed growth profile. Indeed, sectors considered defensive-telecoms, basic consumption, utilities and energy represent only 15% of the MSCI Small caps index, while growth sectors (Technology / Hardware, Consumer Discretionary , health) represent about 1/3 of the index, the first sector remains the industry with nearly 20% of the capitalization. It should also be noted that unlike the Stoxx600, the United Kingdom is not part of the selection, MMS is therefore only focused on continental Europe and therefore there is no currency problem.
We believe that the Eurozone is attractive in the medium term if the economic recovery is confirmed supported by rather low interest rates and energy costs, while the political cycle is completed. Although valuations of growth stocks are still fairly demanding, and a temporary return to "value" cannot be ruled out, new technologies and new economic models, particularly those resulting from digitization, make this theme a " megatrend ".
The long-term potential is clearly in favor of growth stocks and MMS which also includes industrial stocks seems to us to represent an excellent risk / reward ratio in a long-term perspective with a positioning more advantageous than the stoxx600.
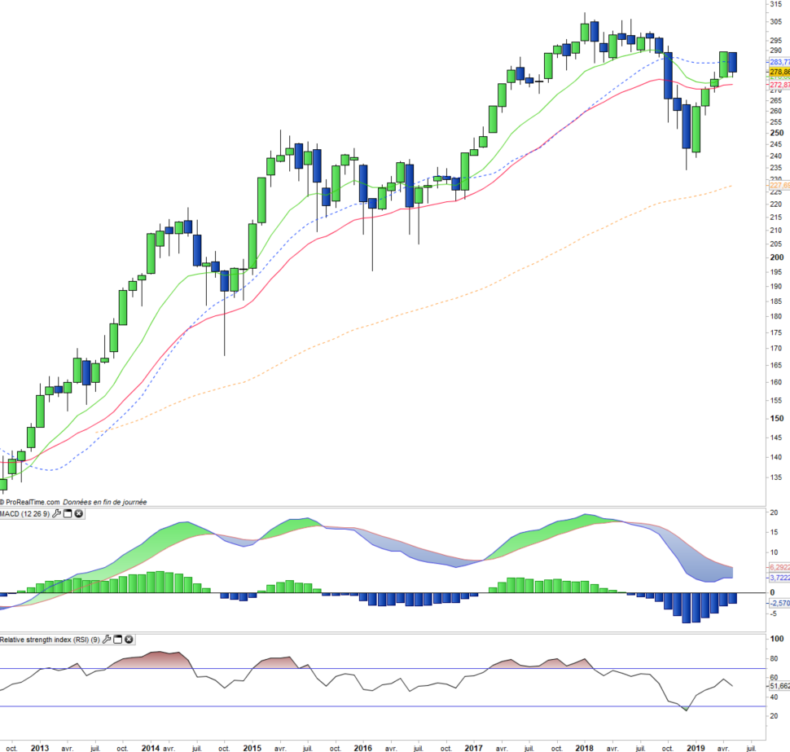
Monthly data
The monthly chart shows the uptrend of the index, which although chaotic, has not been challenged for more than 5 years. The MACD has been installed above the zero line since 2013 and the sharp correction of late 2018 has failed to dislodge it. However, the MACD is negatively oriented while the index pulls back by returning to its moving averages. A bullish reversal of the MACD would validate the start of a new bullish phase.
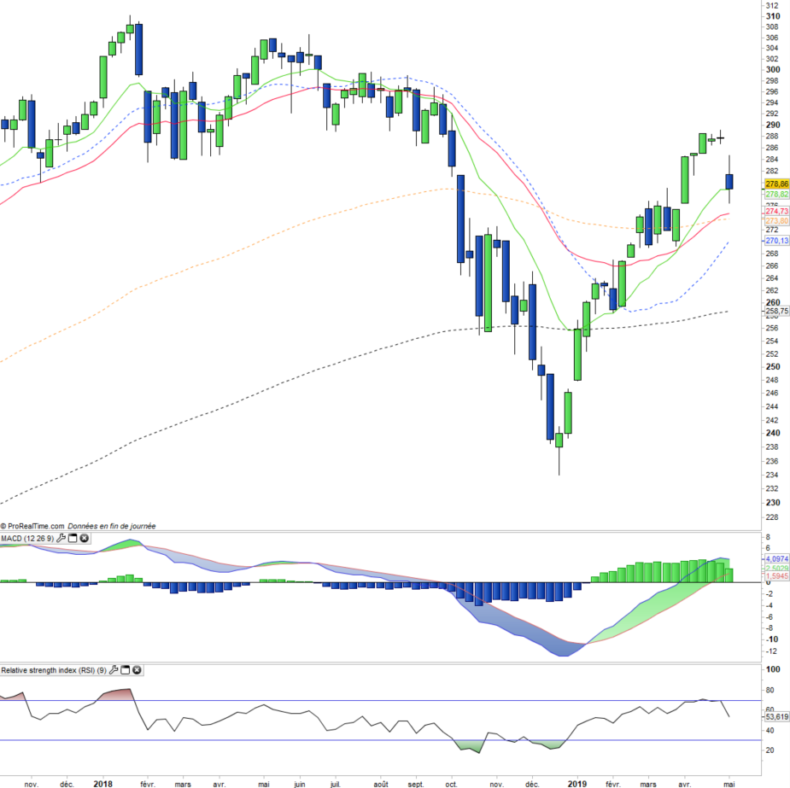
Weekly data
On the weekly chart we see the medium-term trend change validated in April by the crossing of the EMAs12 and 26 and the passage of the zero line by the MACD. A fairly abrupt return on the moving averages does not question the trend, while the EMA100 (at the same level as the EMA26) represents the major support and the pivot point of the trend. However the bearish gap opened this week should have a negative influence in the coming weeks.
Theme
MMS is a UCITS ETF, listed in EUR, which seeks to replicate the MSCI EMU Small Cap Net Return EUR Index (460 european companies)
Characteristics
| Inception date | 01/04/2005 |
| Expense ratio | 0,40% |
| Benchmark | MSCI EMU Small Cap Net Return EUR Index |
| Issuer | Lyxor |
| Ticker | MMS |
| ISIN | LU1598689153 |
| UCITS | Yes |
| EU-SD Status | Out of scope |
| Currency | € |
| Exchange | Euronext Paris |
| Assets Under Management | 219 M€ |
| Replication Method | Physical |
| Dividend | Distribution |
| PEA (France) | Yes |
| SRD (France) | Yes |
| Currency risk | No |
| Number of Holdings | 460 |
| Risk | 3/5 |
Country breakdown
| Germany | 24% |
| Italy | 16% |
| France | 13% |
| Netherlands | 13% |
| Spain | 11% |
| Belgium | 8% |
| Finland | 6% |
| Austria | 4% |
| Ireland | 2% |
| Others | 2% |
Sector Breakdown
| Industrials | 20% |
| Financials | 16% |
| Information Technology | 10% |
| Real Estate | 10% |
| Health Care | 9% |
| Communication Services | 8% |
| Consumer Discretionary | 8% |
| Others | 19% |
Top Ten Holdings
| LEG Immobilien | 1% |
| Cellnex Telecom | 1% |
| ASR Nederland | 1% |
| GB Mining Holding | 1% |
| Orpéa | 1% |
| Interxion Holding | 1% |
| Galapagos | 1% |
| Rheinmetall | 1% |
| Merlin Properties Socimi | 1% |
| Rubis | 1% |


