The NRJ ETF gives the investor access to a basket of 20 stocks in the renewable energy sector.
The index is calculated by Dow Jones from a selection of stocks by SAM (Sustainable Asset Management Management specializing in sustainable development created in 1995). It is an international selection with a strong focus on US stocks, which account for almost half of the index, while Europe accounts for about 1/3 of the index and Samsung SDI (batteries) is also present. The index appears to be well balanced with numerous activities represented, ranging from the production and distribution of energy (Calpine, Nextera) to the manufacture of turbines (Vestas, Gamesa) and energy management (Schneider) and also in component manufacturers (STM and ON semiconductors), automotive suppliers (Borgwarner) and LED manufacturers (Acuity Brands). This, however, results in exposure to foreign exchange risks, mainly related to the evolution of the USD / EUR parity.
We have significant market capitalizations in the index, such as Nextera ($ 57md) or Schneider (€ 36bn), while many stocks are in a range of € 5-15bn, which leaves a lot of potential appreciation. At the time of the energy transition, and while energy consumption will continue to increase significantly in the coming decades, the sector seems very interesting to us to play in a medium-term perspective. In addition, some sub-sectors such as batteries have a very strong growth potential, with developments in the electric car and in industry.
The sector has a rather normal volatility for a growth theme but this is mitigated by a good diversification in terms of segments and geographies and the size of the players.
ETF fees are slightly higher than the sample average, of 0.65% (Assets Under Management: 53 M€).
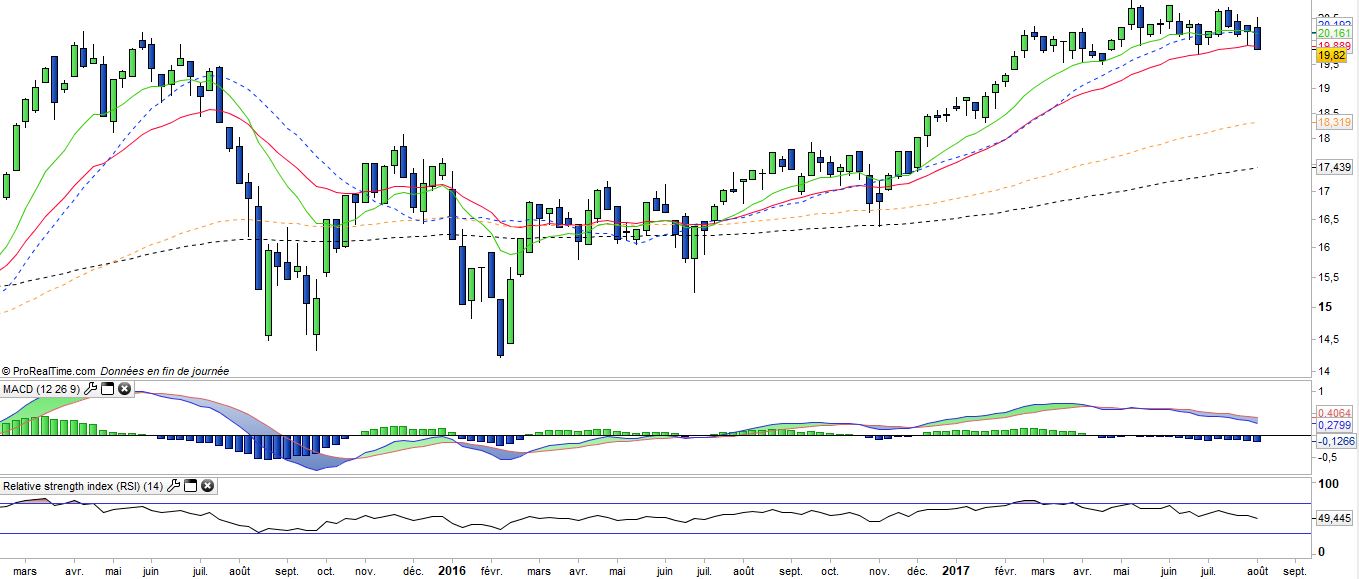
US reforms in renewable energy will be monitored, while the Trump administration appears to be much more favorable to fossil fuels. China also has great ambitions in this field (batteries and renewable energies) and has major players who will represent a formidable competition to the Westerners and Koreans present in this selection. However for some weeks certain stocks are under pressure for different reasons (Samsung entered correction reflecting disappointing Q2 results and the Korean problem), SiemensGamesa which has just lost nearly 30% of its stock market capitalization after its issues in India while Vestas, Schneider And Nextera support the index, which explains the current trading range.