The ETF Lyxor PAF (Africa) was created in 02/2016, is quoted in Euro on Euronext and seeks to replicate the SGI Pan Africa Index composed of 30 stocks, this index is exposed equally in three geographical areas: Africa North, sub-Saharan Africa and South Africa.
For each zone, the 10 most important eligible stocks in terms of market capitalization are retained, since no value can permanently weigh more than 10% of the index.
The costs of this ETF are 0.85% and the AUM approximately 52M €. Replication is indirect (via swap) and there is a dividend capitalization policy.
Alternative ETF: AFK (VanEcK Vectors in USD)
Index & components
The African zone is an emerging zone with high potential, but which starts from a relatively low economic base: Africa's GDP has reached around $ 2900bn in 2018, which is comparable to that of France, for a population of 1.2 billion inhabitants, which should almost double in the next 20 years.
The main African economies are South Africa, Nigeria, Egypt and Algeria. There is no political unity in Africa and the area is not homogeneous from an economic point of view or political systems.
However, the region is very rich in natural resources, and investments (Chinese in particular) have helped improve infrastructure in some countries.
Currently, growth is as important as in Asia (around 5%) and largely dependent on oil and raw materials, it also results from demographic dynamism. The main sectors of activity in the index are mining / materials including gold mining in South Africa, the banking sector as well as the telecommunications sector, noteworthy in the main values the company Napster which holds holdings of e-commerce and technology companies.
Africa remains a fragile zone, exposed to the geopolitical problems and the price of the raw materials with also problems of governance.
This index is very sensitive to macroeconomics, US interest rates or the Chinese economy that impact the price of commodities. All this explains a great volatility during episodes of tension in the markets, to which is added that of currencies. Nevertheless, the potential of this area is considerable, with a long-term view and the current demographic evolution.
Volatility can be exploited to buy PAF.
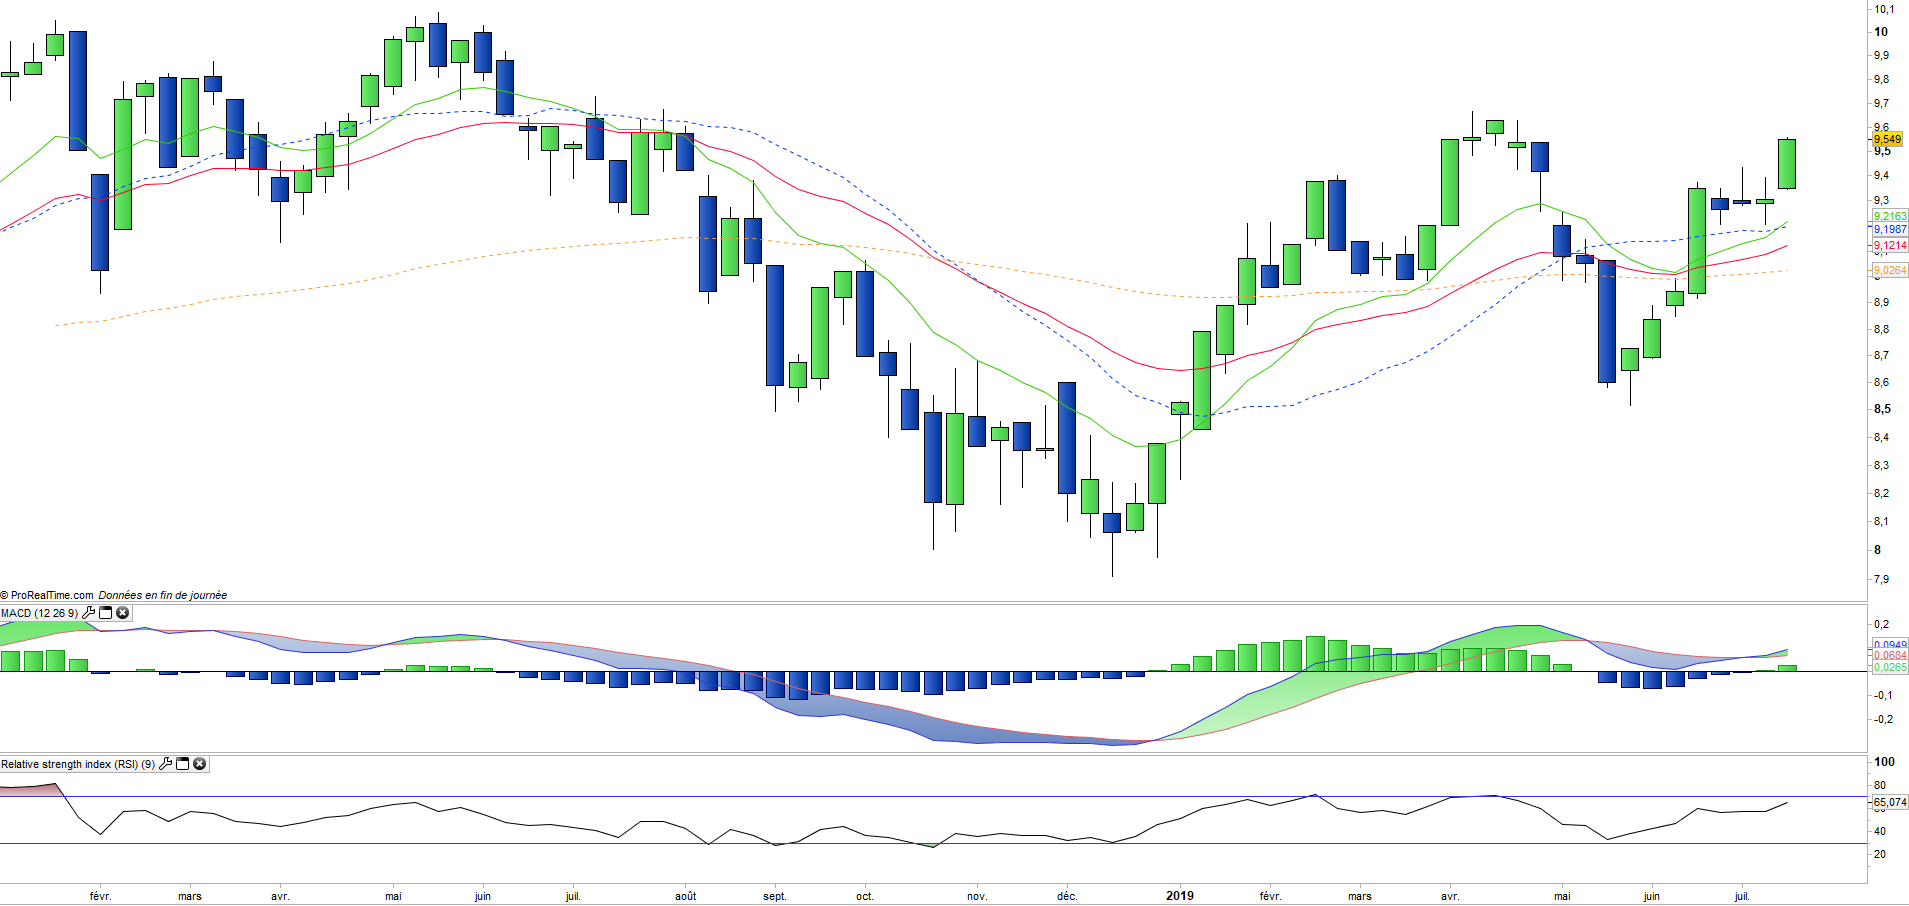
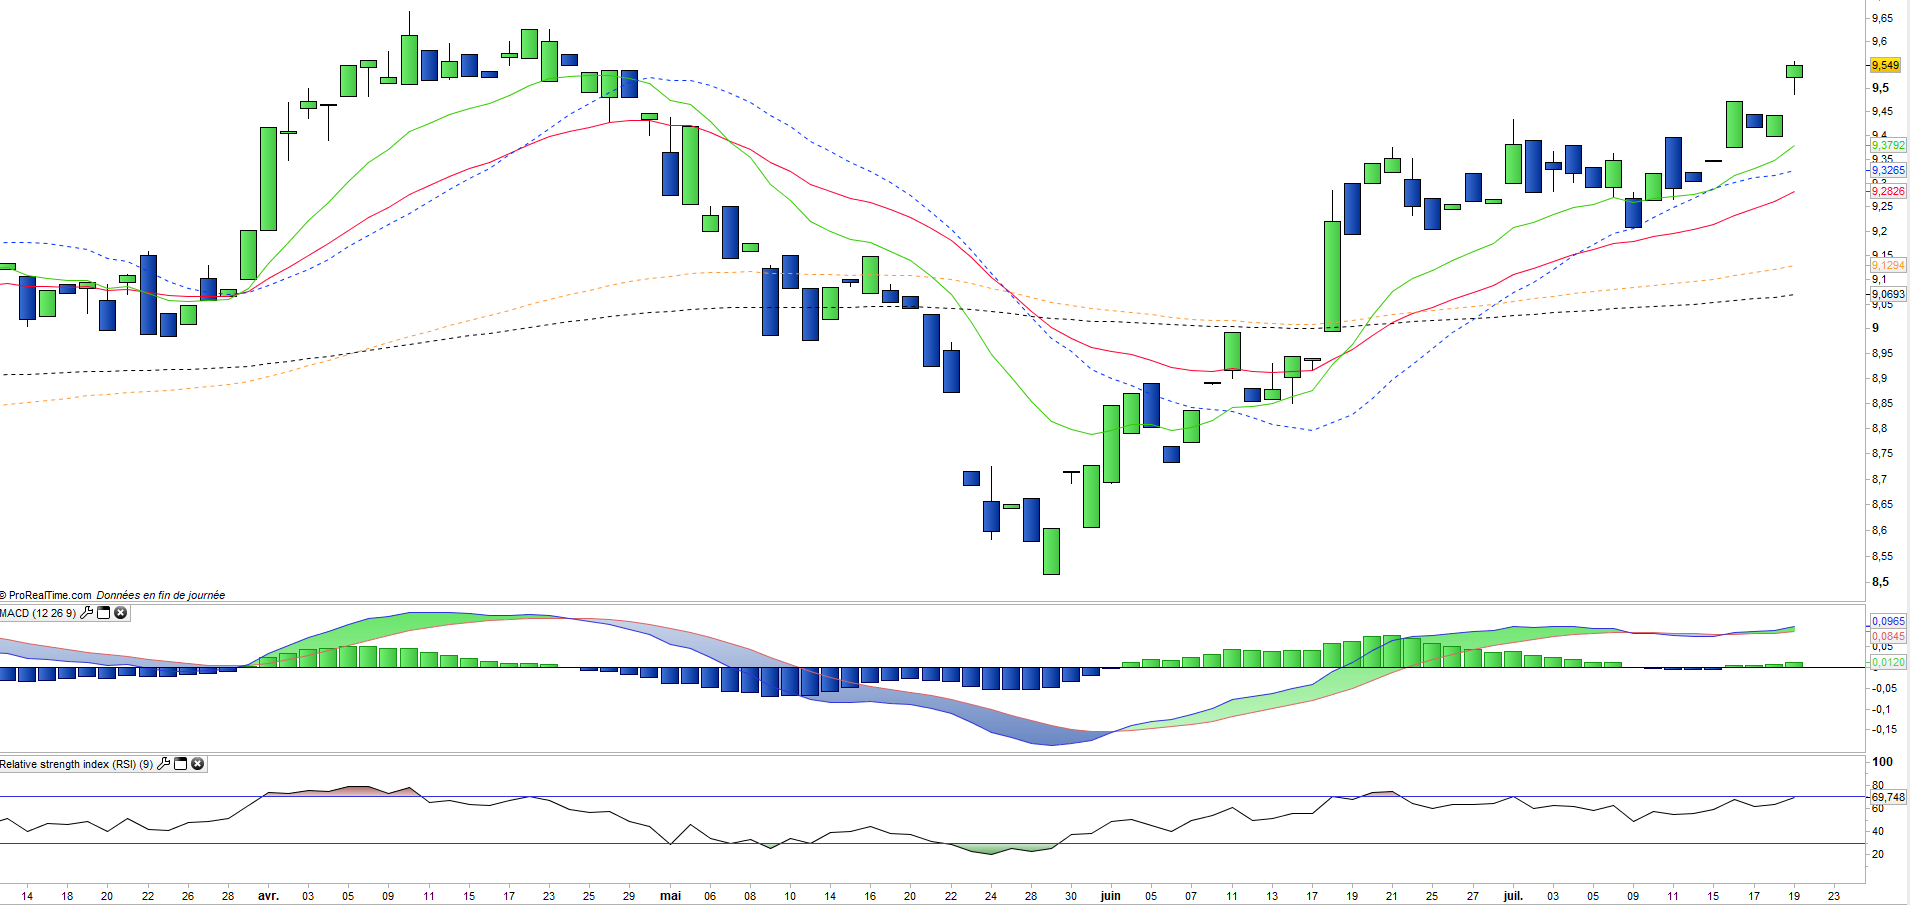
Governance problems continue to shake African countries regularly, as it was the case in South Africa, which weighed on the currency (the Rand). The PAF ETF posted a -15.9% performance in 2018 in the wake of the drop in oil and commodity prices and the main world markets, but rebounded by almost 15% in 2019. The zone remains highly influenced by the evolution of oil prices and commodities (agricultural and metals), which benefits the two major economies, Nigeria and South Africa.
The heavy weighting of South Africa (31% of the weighting) encourages us to follow political developments in this country, as well as gold prices, while gold mining companies represent a significant weight in South Africa and are currently rebounding in the wake of gold prices that are surpassing the resistance of $ 1,400 an ounce.