Oil is a commodity that is a fossil fuel produced by a few countries like Saudi Arabia, the US, Russia, Iran, Iraq, Algeria or Nigeria.
It is extracted by drilling or hydraulic fracturing and is then delivered - processed / refined or not, in consumer countries, mainly European and Asian and can produce fuels such as gasoline, gas oil or kerosene once refined and processed chemically.
Depending on its origin and final destination, oil has different names and its price may also vary. These differences in the price of oil depend on its quality. We differentiate the Arabian Light, which comes from the Middle East, the Brent oil that is produced in the North Sea, and finally the WTI or "West Texas Intermediate" which is produced in the United States and is the benchmark of the oil market.
The reference unit for oil is the barrel, which is actually about 159 liters. The price of a barrel of oil is quoted on the international market continuously, while two financial centers share its rating, namely New York for WTI and London for Brent.
Supply, therefore production and its stability are of course key determinants of the price of a barrel. It is OPEC, made up of several major world producing countries, which is in charge of determining - by consensus - how many barrels a day will be produced and its publications are therefore followed with attention by traders, as was the case recently. Demand factors are also critical. Thus, an increase in the energy needs of a major consumer country may have a greater or lesser influence on the price of the barrel.
Globally, global growth is a very important factor for demand, while oil needs tend to shrink at equal demand, as new technologies tend to reduce consumption. In the long term, the electric car could cause a negative shock on global demand for crude oil, as China is investing heavily in renewable energy.
Since 2014, oil prices have divided by 3 due to a supply shock caused by the arrival on the market of American shale oil which has put very strong pressure on the oil-producing and oil companies that have significantly reduced their investments. This stoppage of industrial investment, in addition to OPEC's production cuts, has for the moment had a moderate bullish impact on crude prices. This is due to the plethoric production of unconventional oil (shale) that floods the market and counterbalances OPEC's reduction efforts.
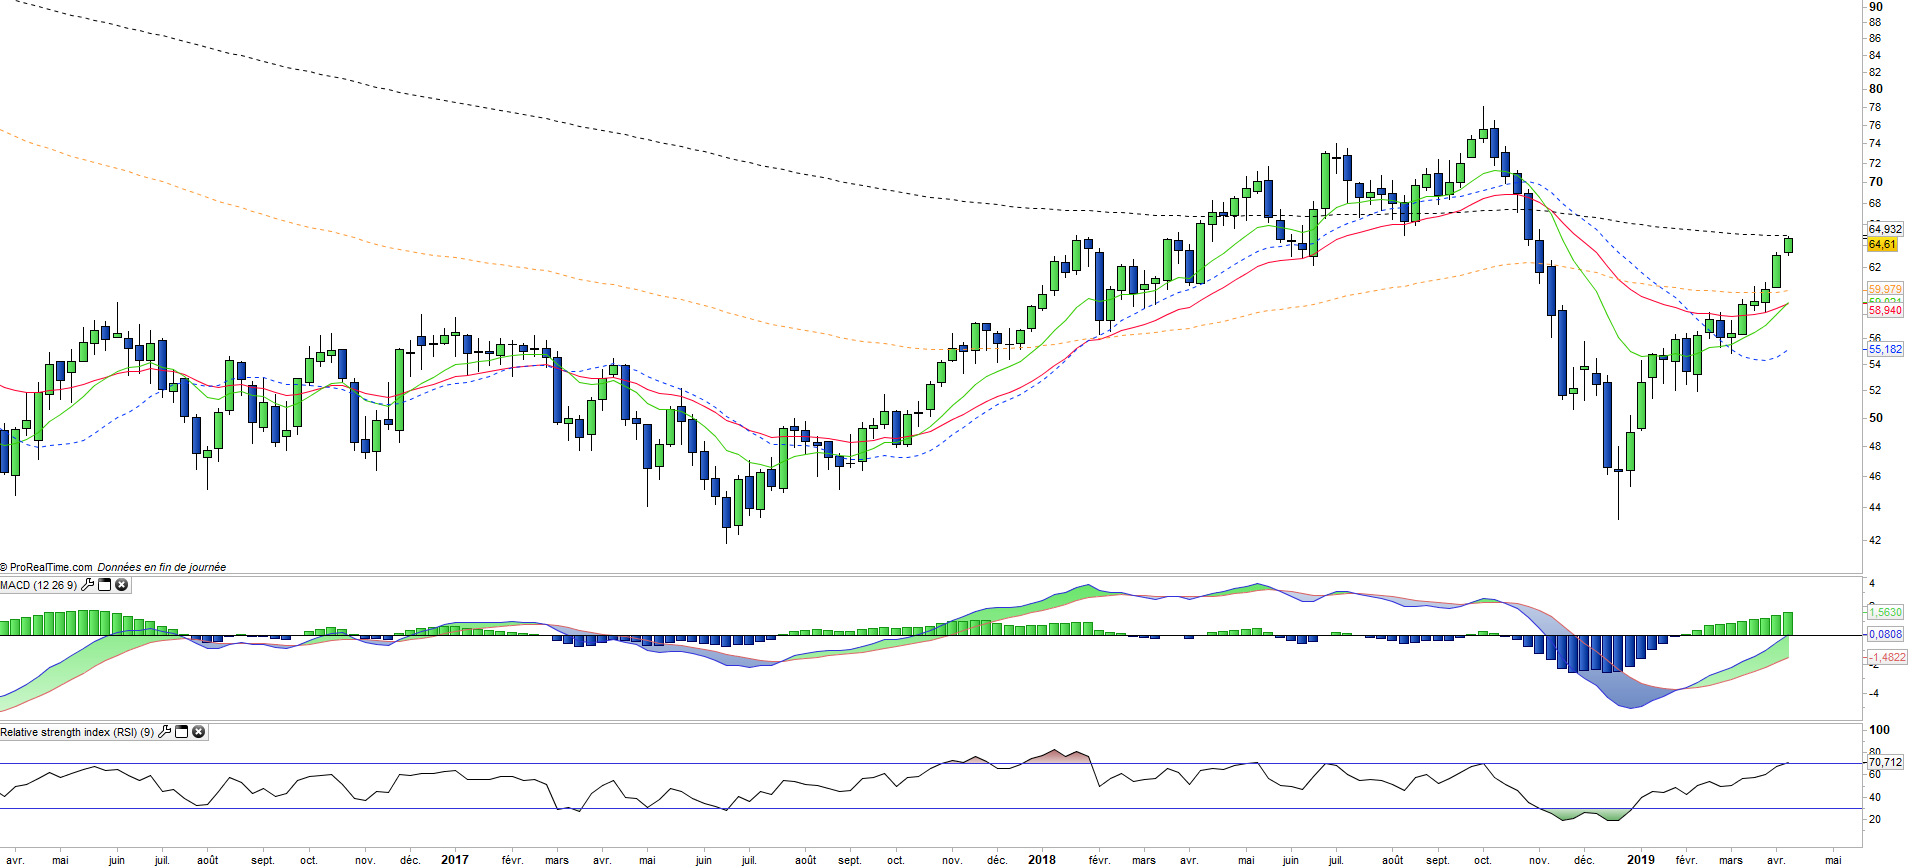
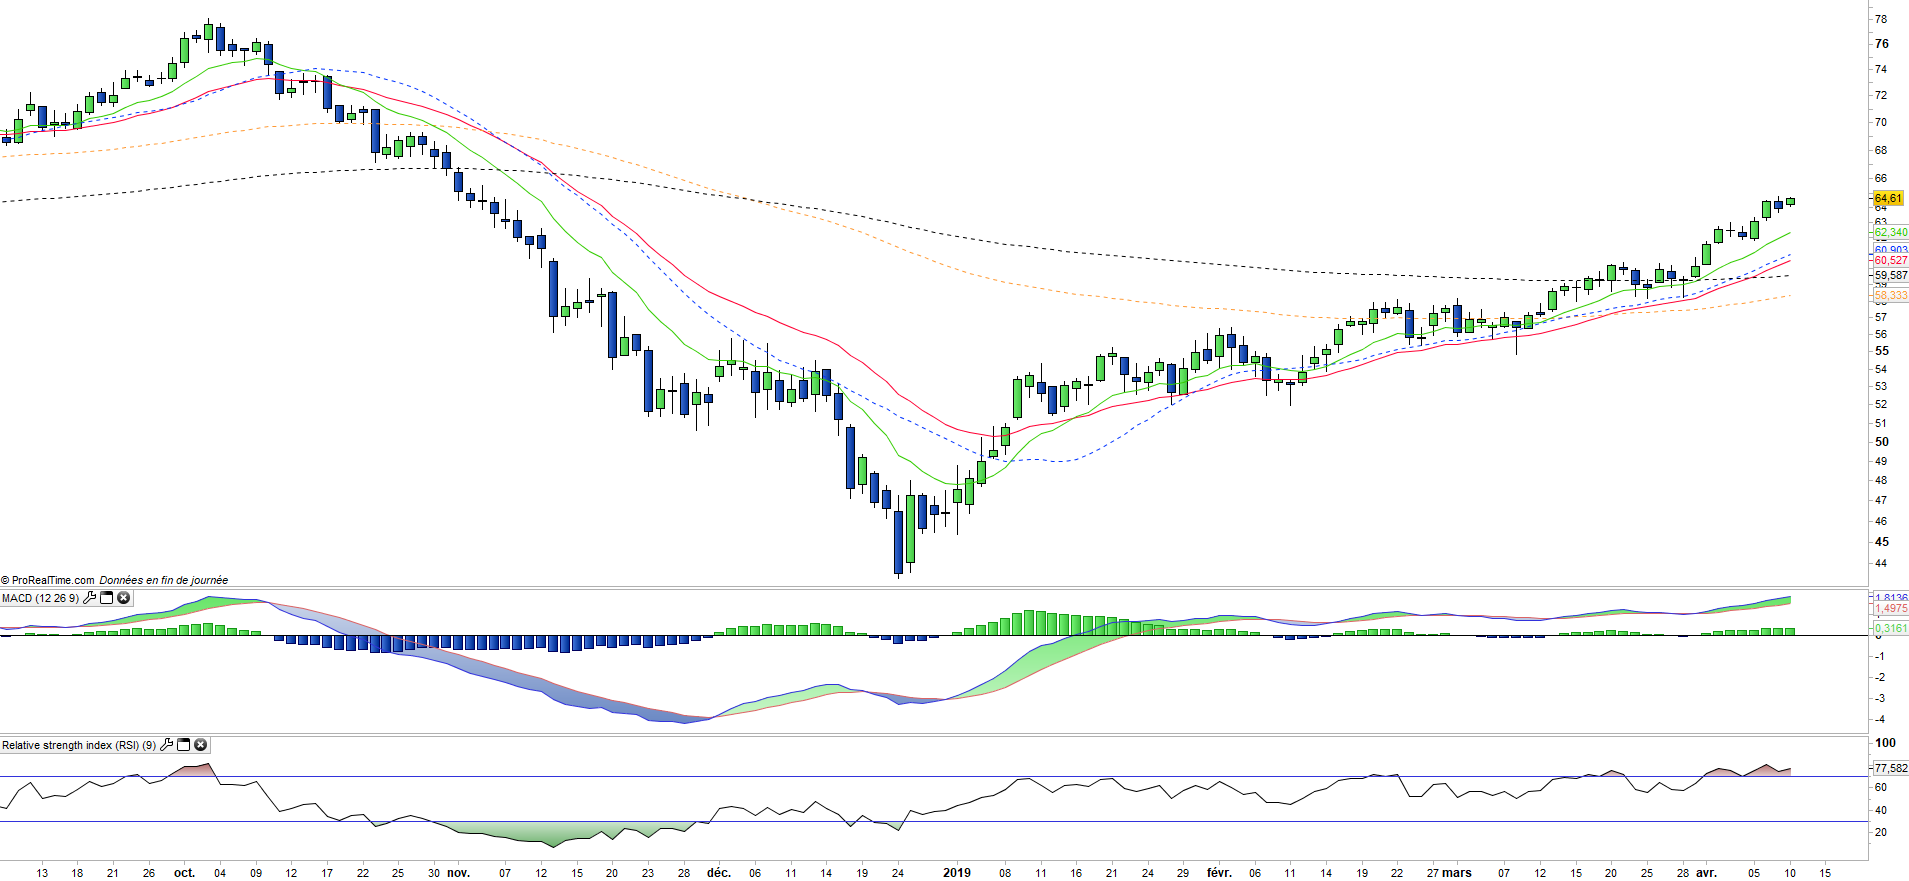
WTI petroleum rose +4.9 in 2017 after a rebound of 9.2% in 2016 and turned down with a drop of 21.2% in 2018 after a spectacular fall of 23% in November and by 34% since the $ 77 highs of early October.
The WTI prices rose strongly by 23% for the moment in 2019, which is linked to the international context (Venezuela, global growth which remains strong) and the firmness of OPEC in the face of D.Trump, as it reaffirmed its willingness to cut production if demand weakened while the target is at least $ 60. Moreover, the full support of central banks for growth, which was reaffirmed by the FED in January, with the pause on the rate hike cycle is a positive factor for crude prices.
The production gap (lower investments made by the majors between 2014 and 2018) is still a medium-term support for crude prices
Instruments : OILWP (ETFS in Euro), OLO (Deutsche Bank in USD), DBO (Invesco in USD)