Lyxor ETF Russia (RUS) - 18/10/2017
Short term strategy : Positive (90%) / Trend +
Long term strategy : Positive (100%) / Trend +
Characteristics of the ETF
The ETF Lyxor RUS (Russia), created in 05/2007, is listed in Euro on Euronext and seeks to replicate the Dow Jones Russia GDR $ index consisting of 12 Russian stocks.
The Dow Jones Russia GDR Index is an index that measures the performance of 85% of GDRs (very close to ADRs, an instrument of listing abroad for a non-US or UK company) traded on the London Stock Exchange, with the largest floating capitalization. The index is weighted by the free-float capitalization of each GDR.
The expenses of this ETF are 0.65% and the AUM of approximately 550M €. Replication is indirect (via Swap) and dividends are capitalized.
Alternative ETFs: RSX (Vaneck Vector, in USD), ERUS iShares, in USD)
Index & components
The ETF RUS is made up of only 12 companies, so it is very narrow compared to other national indices. However, the Russian index is fairly representative of the country's economy, highly concentrated on energy, whose weighting is about 56% due to the presence of the giants Gazprom, Loukoil and Rosneft, while the banking sector accounts for 24% including two large banks, Sberbank and VTB Bank, the remaining 20% are divided between mining companies and industrial companies (consumer goods and technology).
Over the past 10 years, the performance of the Russian index has been negative, which is due to the fall in oil prices and the Western sanctions following the annexation of the Crimea. The Russian economy is at about the same level as Spain, with a GDP of about $ 1200 billion, a diversified economy based on raw materials (gas, oil, minerals, diamonds), and mainly European exports, as well as domestic consumption, which tends to increase gradually, while industry employs nearly 30% of the population, mainly in the chemical, metallurgical and defense sectors.
By 2015, Russia has sunk into the crisis that began in 2014, mainly because of the fall in oil prices that weighs on hydrocarbon revenues, even though non-oil revenues are penalized by weak activity and sanctions that continue to impact the economy. The situation deteriorated in 2015, with the economy entering recession (-3.8%). Inflation continued to rise and a banking crisis hit more than 70 Russian banks, as a result the country's financial reserves melted, the budget deficit widened and the volatility of the ruble worsened. This context continued in 2016 while at the same time easing somewhat (-0.6%), with private consumption, the main driver of activity, remaining constrained.
Russia has emerged from the recession in 2017, but it is not due to virtually non-existent reforms and the challenges remain: lack of competitiveness, under-investment, low production capacity, dependence on raw materials, poor business climate , lack of structural reforms, aging population and authoritarian drift of Vladimir Putin.
Russia is currently enjoying a lull with the recovery of oil prices around $ 50 after the agreement with OPEC and a stabilization of supply. Russia sees its situation on the external scene improving somewhat, due to a certain success in Syria and a stabilization of its relations with Europe. The chaotic policy of the United States led by Donald Trump also allows Vladimir Poutine's Russia to finally appear as a more reasonable actor. A remoteness from Europe and the USA could lead to a later rapprochement between Europe and Russia and to envisage a lifting of sanctions on condition that favorable developments emerge in Ukraine.
Latest developments
RUS's performance in 2016 was + 59%, which also includes currency fluctuations Ruble / Euro, and corresponds to a violent rebound, sililar to that of oil.
Since the beginning of the year, RUS has consolidated by 7.8%, due to relative stagnation and doubts about the trend in crude oil prices, despite the agreement with Saudi Arabia to reduce production until March 2018, which should be prolonged and perhaps deepened, but this still seems insufficient compared to the lasting inflow of shale oil from the US. This could best keep the barrel between $ 45 and $ 60, but the long-term trend seems to be compromised. Russian official statistics (RosStat) reported 2.5% growth on an annual basis in Q217 compared to 0.5% in Q117, which is the best result of the Russian economy since the third quarter of 2012.
The government now assume growth of 2% in 2017. However, investment remains at a historically low level and no reform is on the horizon and the diversification of the economy does not materialize. Moreover, the new US sanctions decided this summer are likely to weigh on the business climate and on the decisions of foreign groups to invest in Russia. The effects of the sanctions on the Russian economy could be felt in the long term, while they have already drastically restricted the Russians' access to international markets to finance themselves. Sectoral sanctions have also severed the country's access to Western weapons and energy technologies. The Russian economy thus continues to function by inertia but risks gradually losing momentum due to lack of investment and modernization.
The valuations are completely overwritten with a PER of around 8x for 2017.
Monthly data
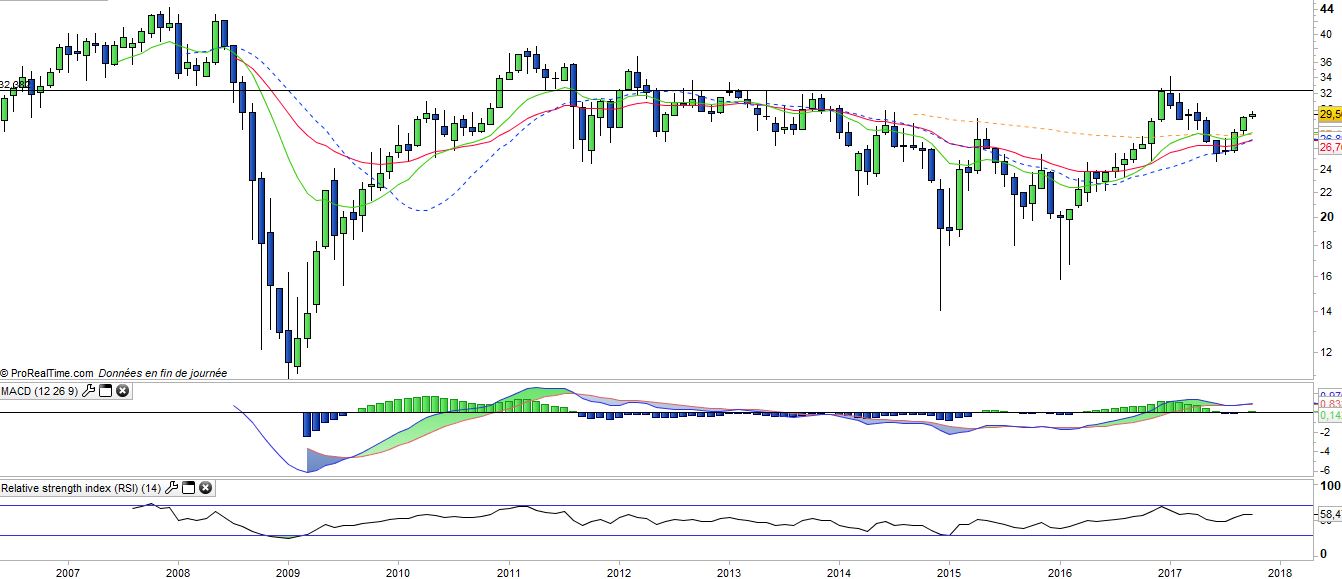
The monthly chart shows that the long-term trend has returned positive since the fall of 2016 due to the bullish crossover of the monthly EMA13 an EMA26 and the crossing of the zero line by the MACD.
The very strong consolidation of the index throughout the first half was stopped by the EMA20 and a sustained rebound has been organized since August, which confirms and validates the upward trend. The next objective is materialized by the January high in the area of 34 €.
Weekly data
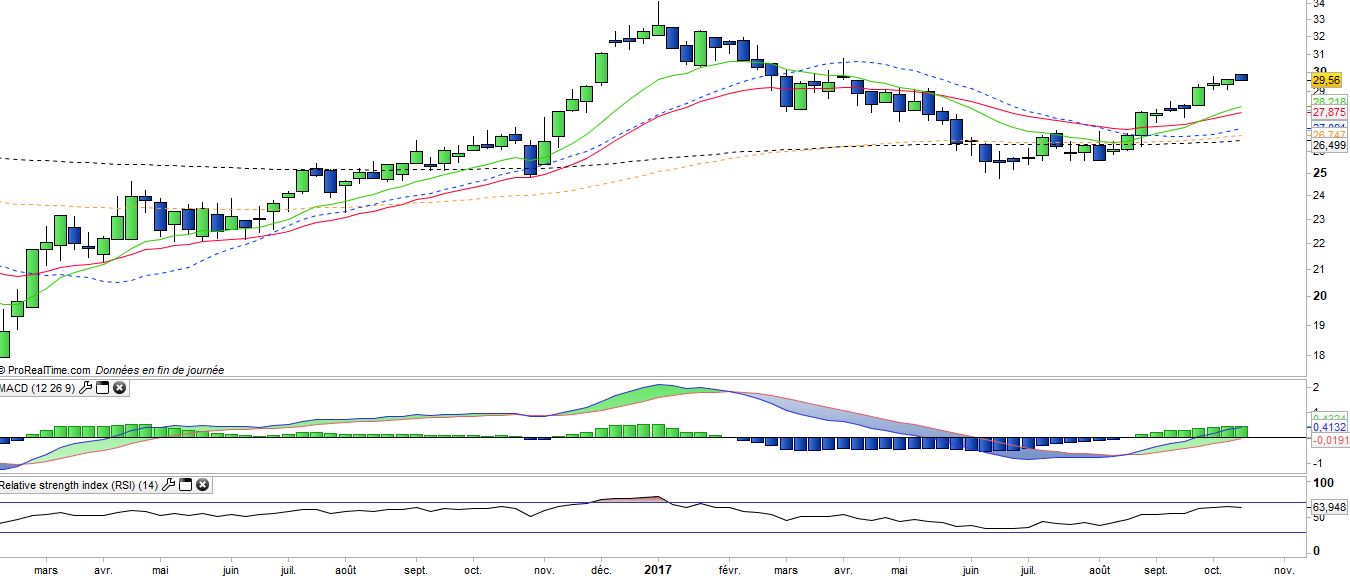
On the weekly chart, the trend is clearly positive and accelerating since the crossing of the EMA13/26. Prices should now accelerate, as they are still far from the highs of the beginning of the year while the oscillators are not overheating.
The bullish potential is significant, and there is an important axis of symmetry around 32 € that should be joined swiftly.
ETF Objective
RUS is a UCITS compliant ETF that aims to track the benchmark index DJ Russia GDR $.
The Dow Jones Russia GDR IndexSM seeks to measure the performance of the leading Russian Global Depository Receipts (GDRs) traded on the London Stock Exchange, based on float-adjusted market capitalization.
Characteristics
| Inception date | 20/06/2006 |
| Expense ratio | 0,65% |
| Issuer | Lyxor |
| Benchmark | Dow Jones Russia GDR |
| Ticker | RUS |
| ISIN | FR0010326140 |
| UCITS | Yes |
| EU-SD Status | Out of Scope |
| Currency | € |
| Exchange | Euronext Paris |
| Assets Under Management | 550 M€ |
| Replication method | Indirect (swap) |
| Dividend | Capitalization |
| PEA (France) | No |
| SRD (France) | Yes |
| Currency Risk | Yes |
| Number of Holdings | 12 |
| Risk | 4/5 |
Country Breakdown
| Russia | 100% |
Sector Breakdown
| Energy | 56% |
| Financials | 24% |
| Consumer staples | 11% |
| Materials | 9% |
Top Ten Holdings
| Sberbank | 20% |
| Gazprom | 18% |
| Lukoil | 16% |
| Magnit | 8% |
| MMC Norilsk | 8% |
| TatNeft | 7% |
| Novatek | 7% |
| Rosneft | 4% |
| VTB Bank | 3% |
| Surgutneftegas | 3% |