The Russell 2000 Index is a very broad index that can be used to profoundly address the universe of US mid caps.
The interest of this index is in addition to the high number of components, characterized by the great diversity of the sectors addressed: the financial (c.18%), the technological compartment (c.15%), the industry (c.15). %), health (c.15%) and consumer goods (c.12%) are the main sectors, in a very balanced index in the end and very representative of the US economy.
However, we can notice that the growth themes are more represented, compared to sectors considered as mature, such as energy (3%), utilities (4%) or telecommunications (4%), which are historically heavily represented. in big indices like the Dow Jones for example.
The companies that make up the Russell2000 are often companies that are already well structured internationally and therefore in a position to take full advantage of the recovery of the global cycle. These companies are, by their average size, more sensitive to the business cycle. The Russell 2000 has risen by + 12.5% since the beginning of the year (against + 15.2% for the S & P500), after a decline of -12.2% in 2017 (against -6.2% for the S & P500).
The Russell2000 / S & P500 spread becomes negative again in the short term, while investors are paying close attention to these divergences, as the Russell 2000 trend's decline or waning trend is often seen as a leading indicator of the fall in the major indices. The Russell 2000 is considered an "amplifier of the trend". The divergences can hardly be explained by sectoral biases, and more naturally by the interest of the thematic of growth values according to the policy of the FED on the rise of the rates and the vigor of the US economy.
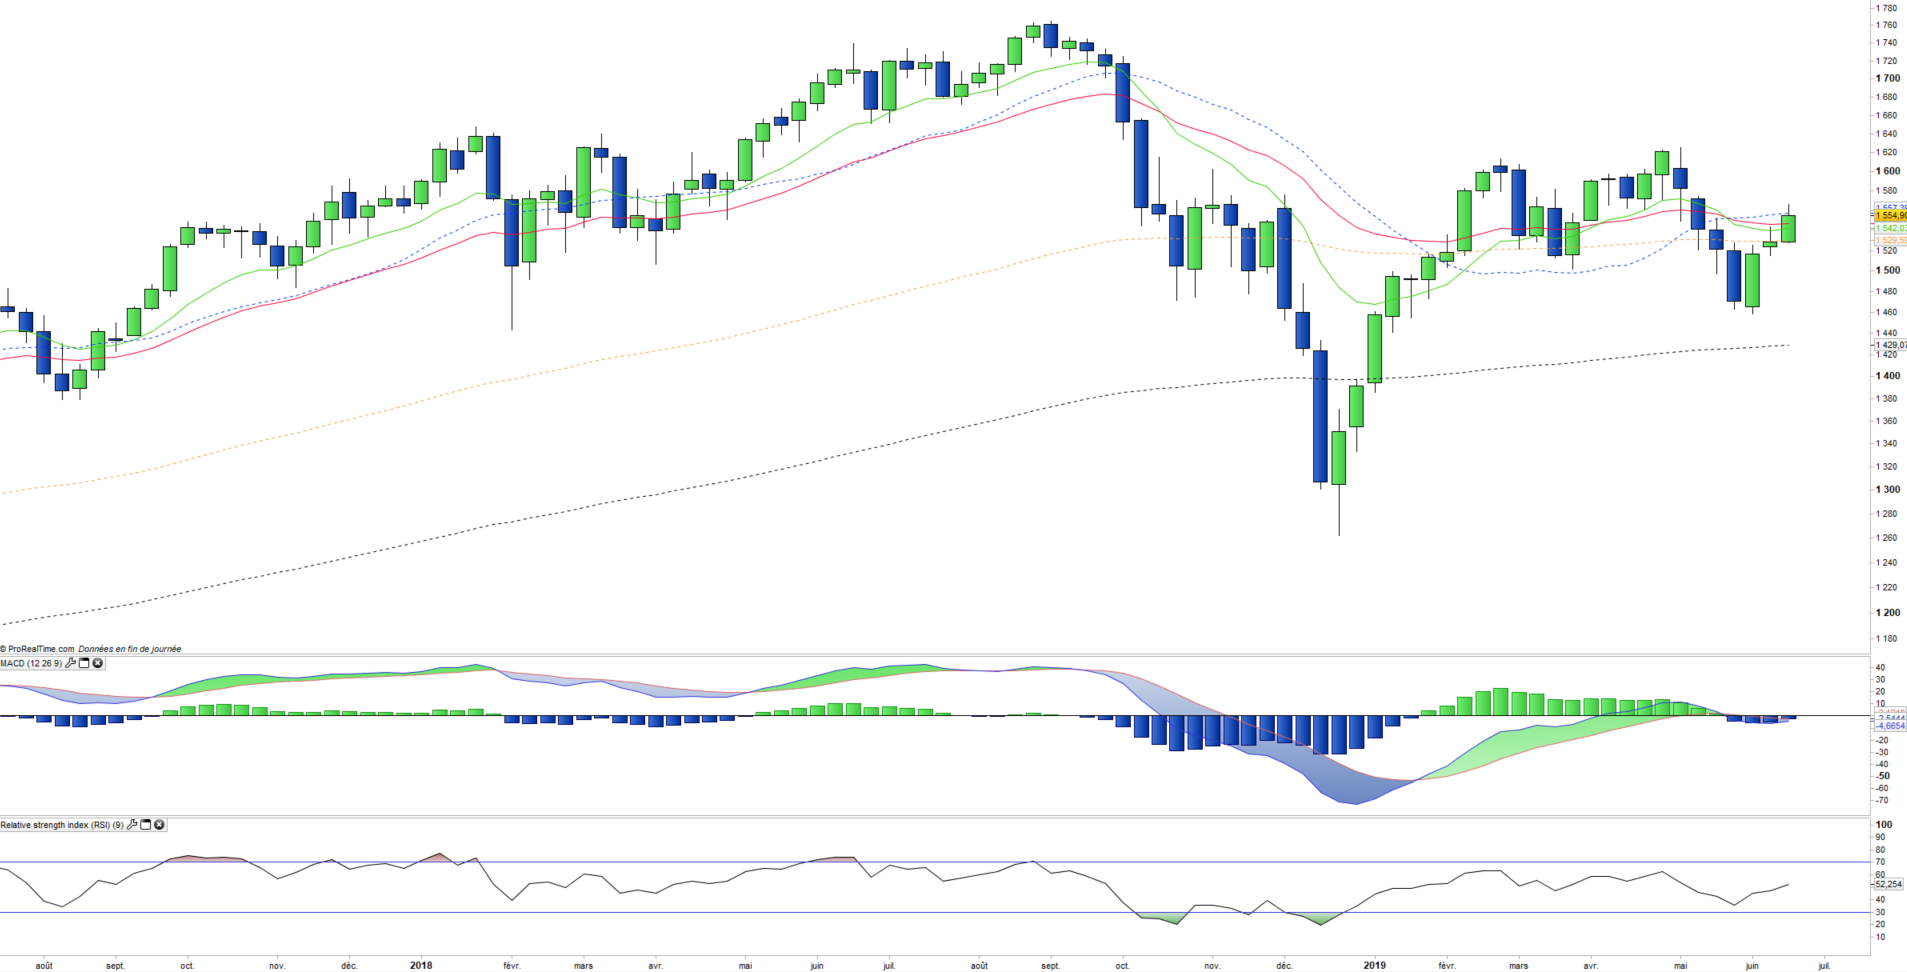
The negative inflection on the index is clearly attributable to the anticipated slowdown in the US economy, or even a recession despite the Fed rate cuts.
Instruments: IWM (iShares in USD), VTWO (Vanguard in USD), RUS2 (Lyxor in USD), RS2K (Lyxor in EUR daily hedged)