The XSD ETF (SPDR) created in 01/2006 is listed in USD on the Nyse and aims to faithfully reflect the US semiconductor industry, through the S & P Semiconductor select industry index. XSD is made up of 35 all-American stocks and is capped in terms of weightings, which limits the weight of giants such as Intel or Texas Instrument to about 4% of the index.
This ETF bears a 0.35% fee with AUM of approximately $307M. The replication method is direct (physical) and the dividend distribution is quarterly.
Alternative ETFs: SOXX (iShares in USD), PSI (Powershares in USD),
Index & components
XSD replicates a diversified index of the US semiconductor industry, with market capitalizations ranging between $ 650m and $ 250bn (Intel) while limiting the maximum weighting at around 4%. This has the consequence of giving a large place to the midcaps while including the American leaders such as Intel, Texas Instrument or Qualcomm.
The index is also more volatile in nature, as large caps play less of a buffer role. The semiconductor industry remains cyclical, as it depends on final demand and therefore on global consumption for a large part (smartphones, PCs, cars, etc.) and also depends on capacity, particularly with regard to memories. But it is mainly a growth sector, because of the increasing weight of electronics in most products and infrastructures while the constant increase of computing power (Moore's law) is a structural factor of renewal of products.
After having exceeded $ 200 billion in 2000 and $ 300 billion in 2010, the global semiconductor market reached the $ 420 billion mark in 2017, an increase of about 22% in global chip consumption. This strong increase is due to the rise of the memory market, which jump by 52%. The supply tensions that are emerging in the memory market are allowing manufacturers of Drams and Flash NAND to increase their prices, thus boosting their revenues and margins. This is what allows Samsung to overtake Intel leadership, which was ranked as the world's largest semiconductor manufacturer since 1992.
But the backlash is already scheduled for 2019: the increase in production capacity of manufacturers of memory-mainly Chinese -will lead to saturation and then to falling prices. Some studies show that final demand for computer and telecom terminals is expected to decline this year and therefore will not drive the increase in chip consumption. Thus, overall, the market for all data and communications terminals (PCs, tablets, ultramobile terminals and mobile phones) is expected to stabilize at 2.362 billion pieces in 2018.
Latest developments
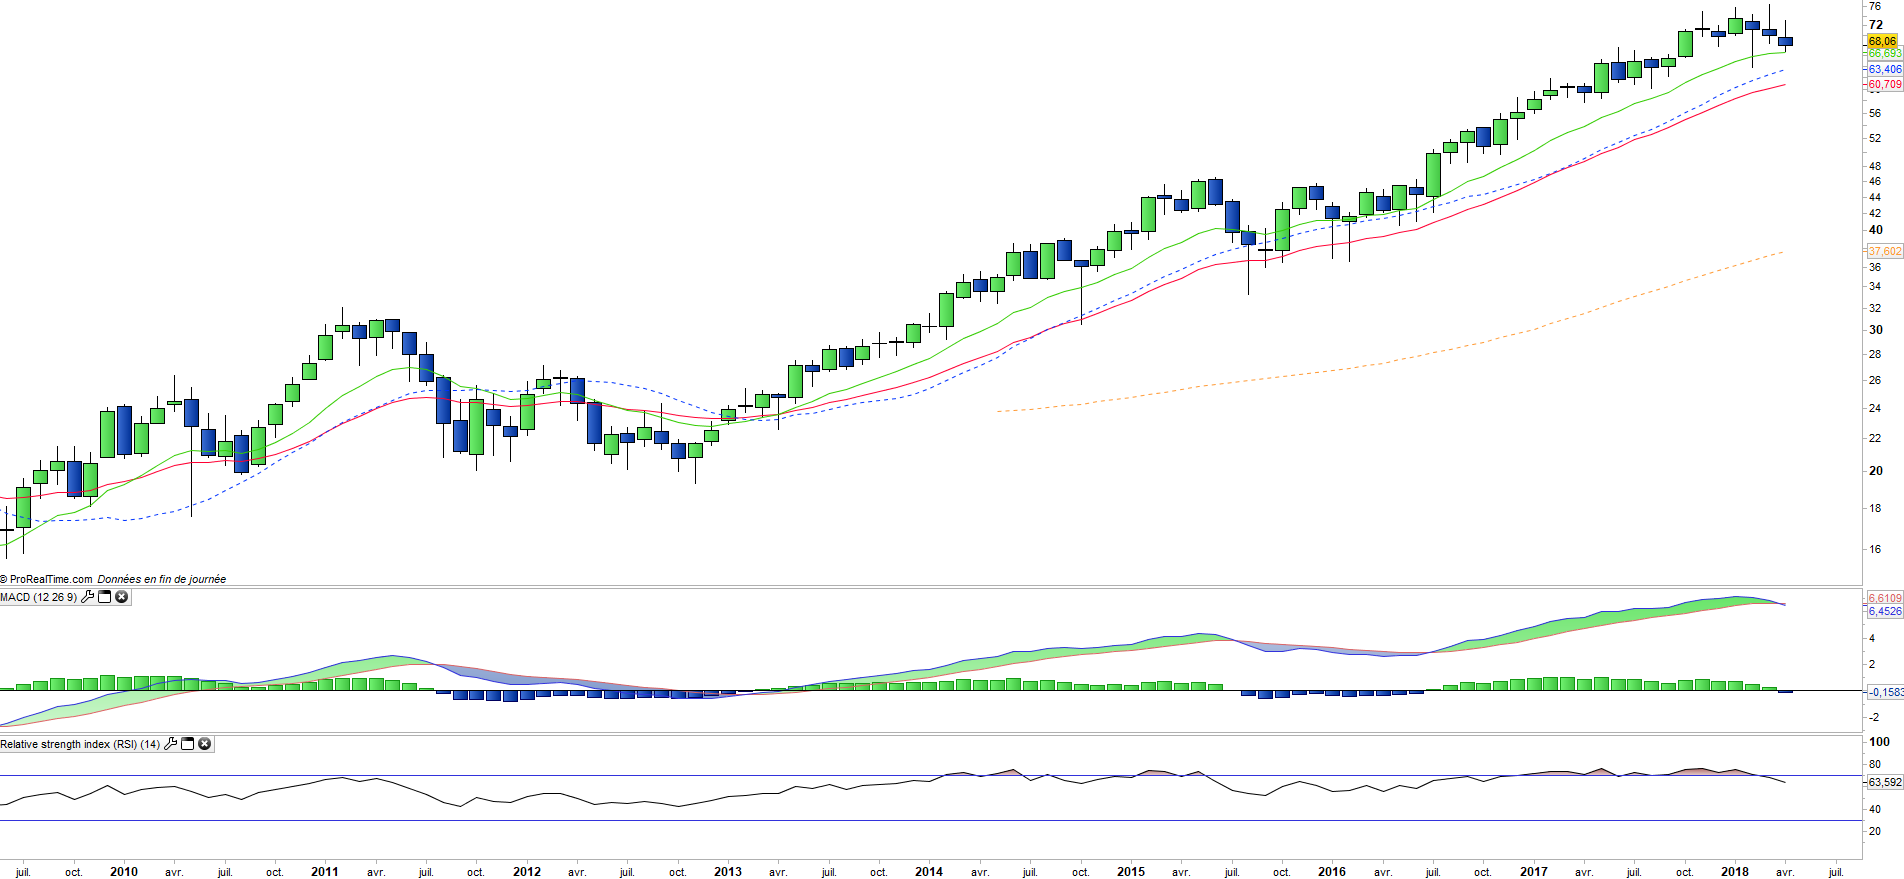
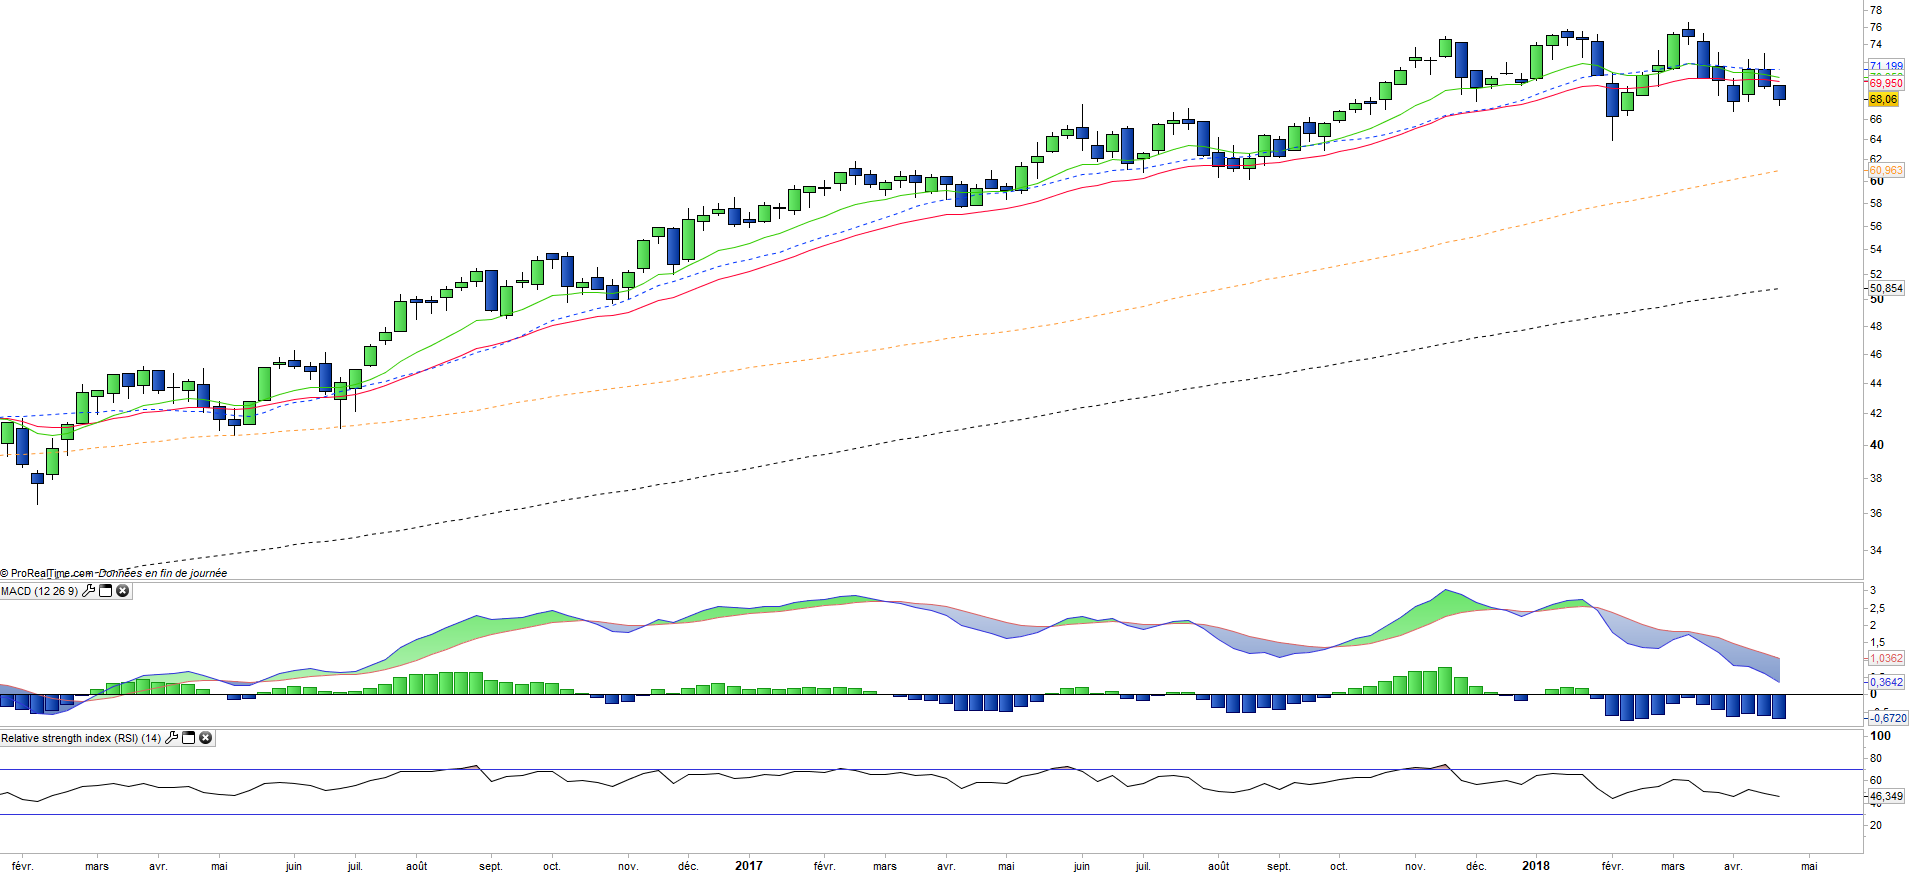
XSD down -2.9% since the beginning of the year after a + 25% rise in 2017 which closed 5 consecutive bullish years.
After a rise of 22% of the market in 2017 which reached $ 420 billion, mainly driven by memories (+ 52%), the year 2018 could be more difficult. The profit warning of some manufacturers at T118 (AMS and Hynix) seem to indicate a slowdown in mobile sales that could be related to Apple. In addition, the rise in the prices of the memories begins to find its limits all the more as new capacities will see the day in 2019 in China.
A possible slowdown in mobile sales coupled with lower memory prices could have a significant impact on the semiconductor market in 2018.