The ETF Lyxor TNO (European Technology UCITS) was created in 08/2006 and is listed in Euro on Euronext. TNO seeks to replicate the Stoxx Europe 600 Technology (SX8R) index, which is composed of the 25 leading European technology stocks.
The cost of this ETF is 0.3% and the AUM are approximately 57M€. Replication is indirect (via Swap) and dividends are capitalized.
Alternative ETFs: EXV3 (iShares in Euro), SYQ (BNP Theam, in Euro)
Index & components
This index is relatively concentrated with only 25 stocks. The first three caps of the index (SAP, ASML Holding and Nokia) represent 51% of the total and have fairly high market capitalizations (€ 29bn for Nokia, € 63bn for ASML and € 117bn for SAP).
This sector is characterized by high growth rates and high multiples, but most of the companies that make up the index do not disappoint and regularly revise their outlook on the upside due to very strong positions, as a world leader with duopoly (for SAP) or a leading actor for laser lithography (ASML). The technological sector is key in the context of major industrial changes and is part of major modernization movements and productivity factors, new services (digitization, new generation network equipment, etc.).
This sector is expected to be one of the biggest winners of global growth, making it eligible for our long-term strategy (Megatrend Euro), especially since highly qualitative companies (ex top 3) often N°1 in their segment are heavily weighted, such as Dassault Systemes (3D digital applications), Infineon (automotive electronic components) and Sage (software for SMEs). All of the companies in this index account for a large share of their sales in the US and thus have a significant exposure to the US dollar and the US economy, some of which are also present in Asia, particularly in China and Japan. However, we consider that the direct foreign exchange risk is low because most companies are quoted in euros.
The volatility of this tracker is not particularly high and is strongly influenced by the evolution of the Nasdaq and naturally GAFAs, Apple's developments have especially a lot of impact on the technology compartment in general and its supply chain in particular (electronic components such as Dialog or AMS). The high valuation of this index implies regular double-digit growth rates over time. However the long-term themes tend to multiply (Blockchain, IA, Robotics ...) which always feeds more hope of growth.
Latest developments
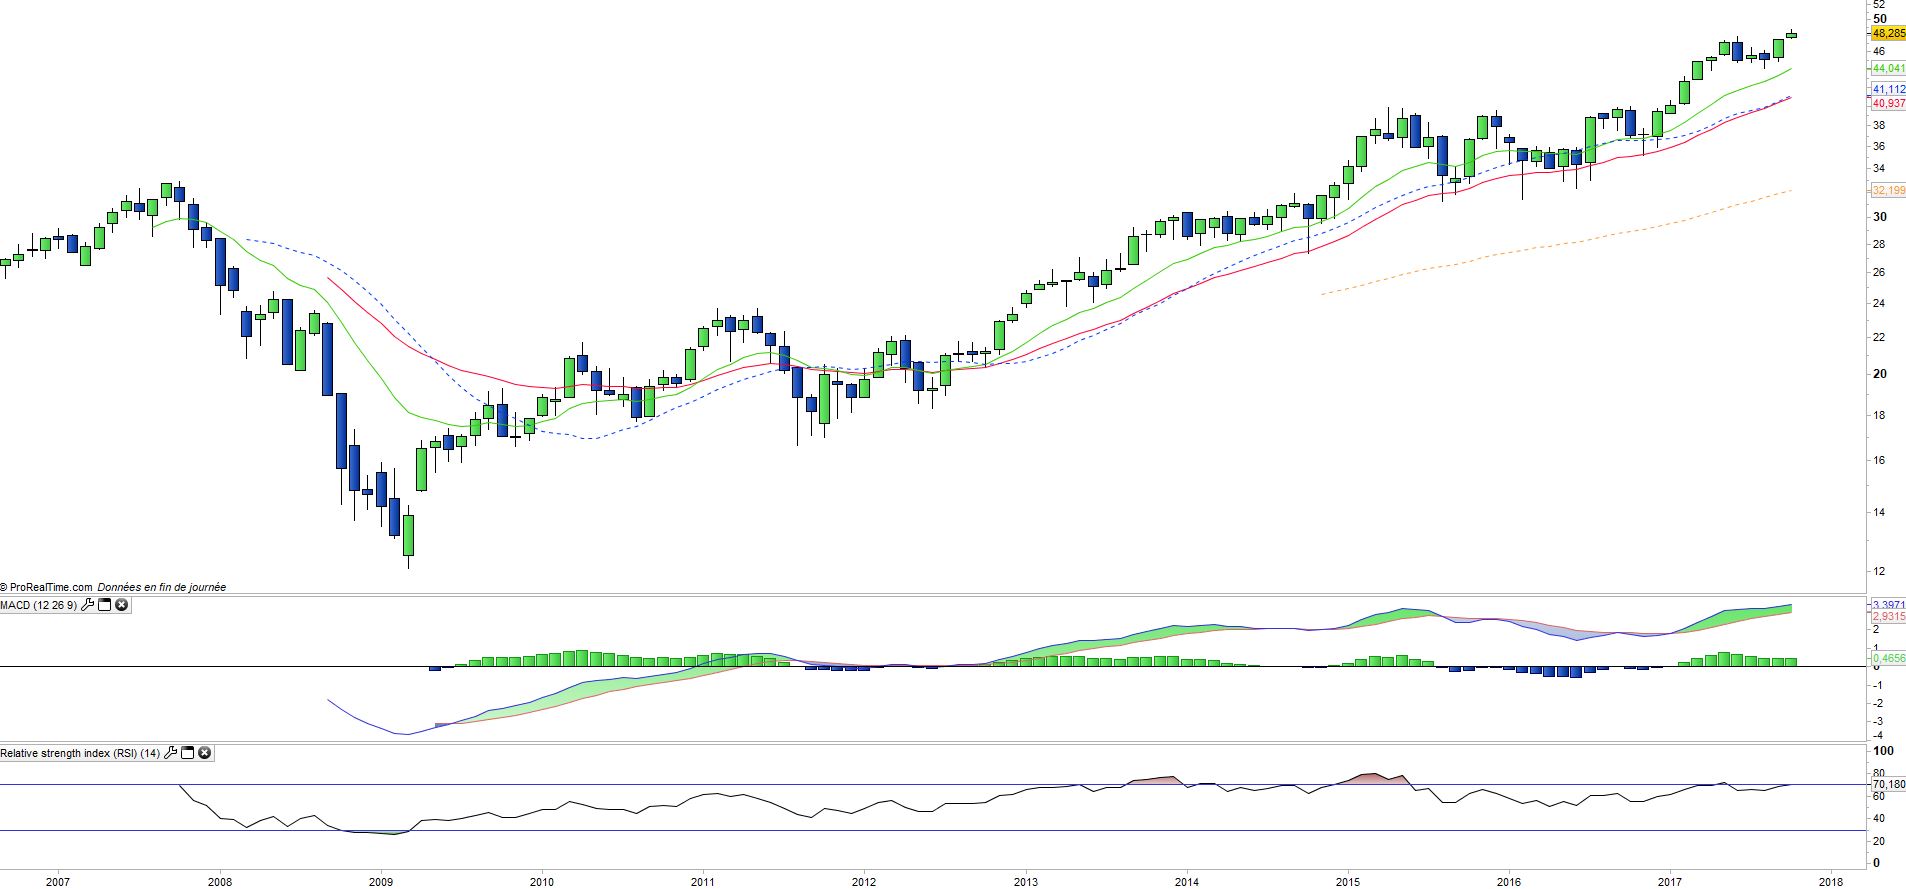
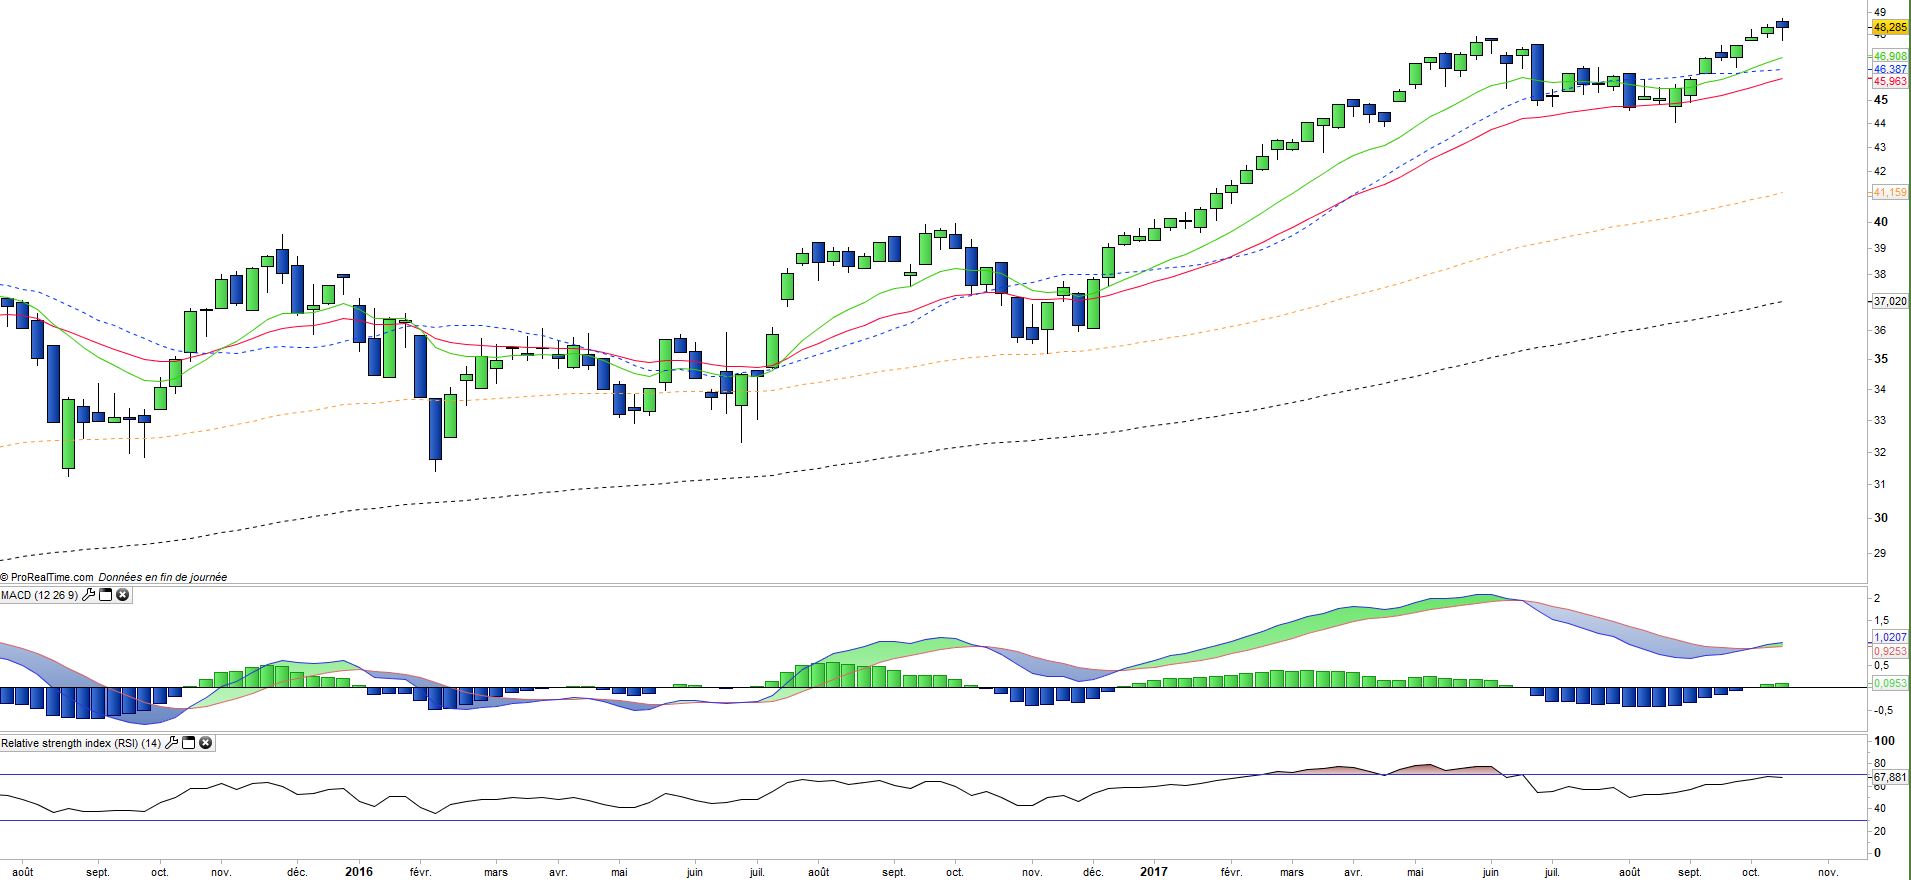
In 2016, the ETF TNO achieved a performance of 4%, above that of the stoxx600 (1.7%), despite very heterogeneous performances between stocks, positive for SAP, Infineon or ASML, and negative for Nokia, Ericsson or Cap Gemini. This trend accelerated in 2017 with an increase of 22.4%, still clearly above the index, with a very strong contribution from ASML (+ 40%) and SAP (17%). The rise of the Euro / USD is to be monitored because if it accelerates, become a drag on earnings growth.
The third quarter results confirm the strong momentum of SAP and ASML, which should continue to be the drivers of the index. Semiconductors (excluding Apple's supply chain) remain well-oriented, as are IT services companies such as Atos and Cap Gémini, but the weak point of the index remains telecom equipment manufacturers such as Nokia and Ericsson, whose growth prospects are reduced to the prospect of 5G spreading by 2020, while costs cutting actions reach its limit. Valuations are tight (around 30x profits) and retain little upside potential in the short term.