OIL (Lyxor) is an ETF which replicates the Stoxx Europe 600 Oil & Gas index, composed of the main European stocks in the sector.
This index is rather concentrated since it has only 21 holdings. By geography, the index is mainly exposed to the Euro zone with a weighting of approximately 31% for France, 16% for the Netherlands and 10% for Italy while the UK weighs almost 21%.
The ETF OIL bears costs of 0.3% which are in the market average with AUM of approximately €270 million. The replication method is indirect (via a swap) and dividends arey capitalized.
Index & components
This OIL & GAS index is concentrated as it comprises only 21 companies that are essentially large-cap stocks, while the top 3 oil majors, which represent 60% of the index, weigh each around € 100bn market capitalization: Total (30.1%), Royal Dutch Shell-A (15.4%) and BP (14.6%).
Industrials such as Neste Oil (refining), Technip (engineering) or Vestas (wind power) are also included. These companies are linked to oil prices, but sometimes in opposite directions (refining is all the more profitable because the oil price is low and stable as is the case today), renewable energies are attractive when oil is expensive, while petroleum services are directly correlated with crude oil prices and present an increased risk of volatility in a period of uncertainty in both demand and supply.
The current period is characterized by oversupply coming from shale oil, known as "unconventional" and which has already caused a significant drop in oil prices since 2014. Oil prices are currently contained in a trading range between $ 55 and $ 45 which is explained by the cost price of shale oil players around the $ 50. Above this level, the production of shale becomes abundant and conversely below $ 45, quasi-total shutdown of shale production has a recall effect on prices. The cost of shale actors tends to decline but bottlenecks could occur at a certain level of production, so the short / medium term remains uncertain, especially as world demand remains robust.
In the longer term, the electric car and the lower consumption of combustion engines should have a deflationary effect on crude oil prices. The major oil majors are already investing heavily in oil & shale gas, as well as in renewable energies. They should therefore continue to optimize their asset portfolios in the coming years with little risk, while oil services players are much more exposed.
Latest developments
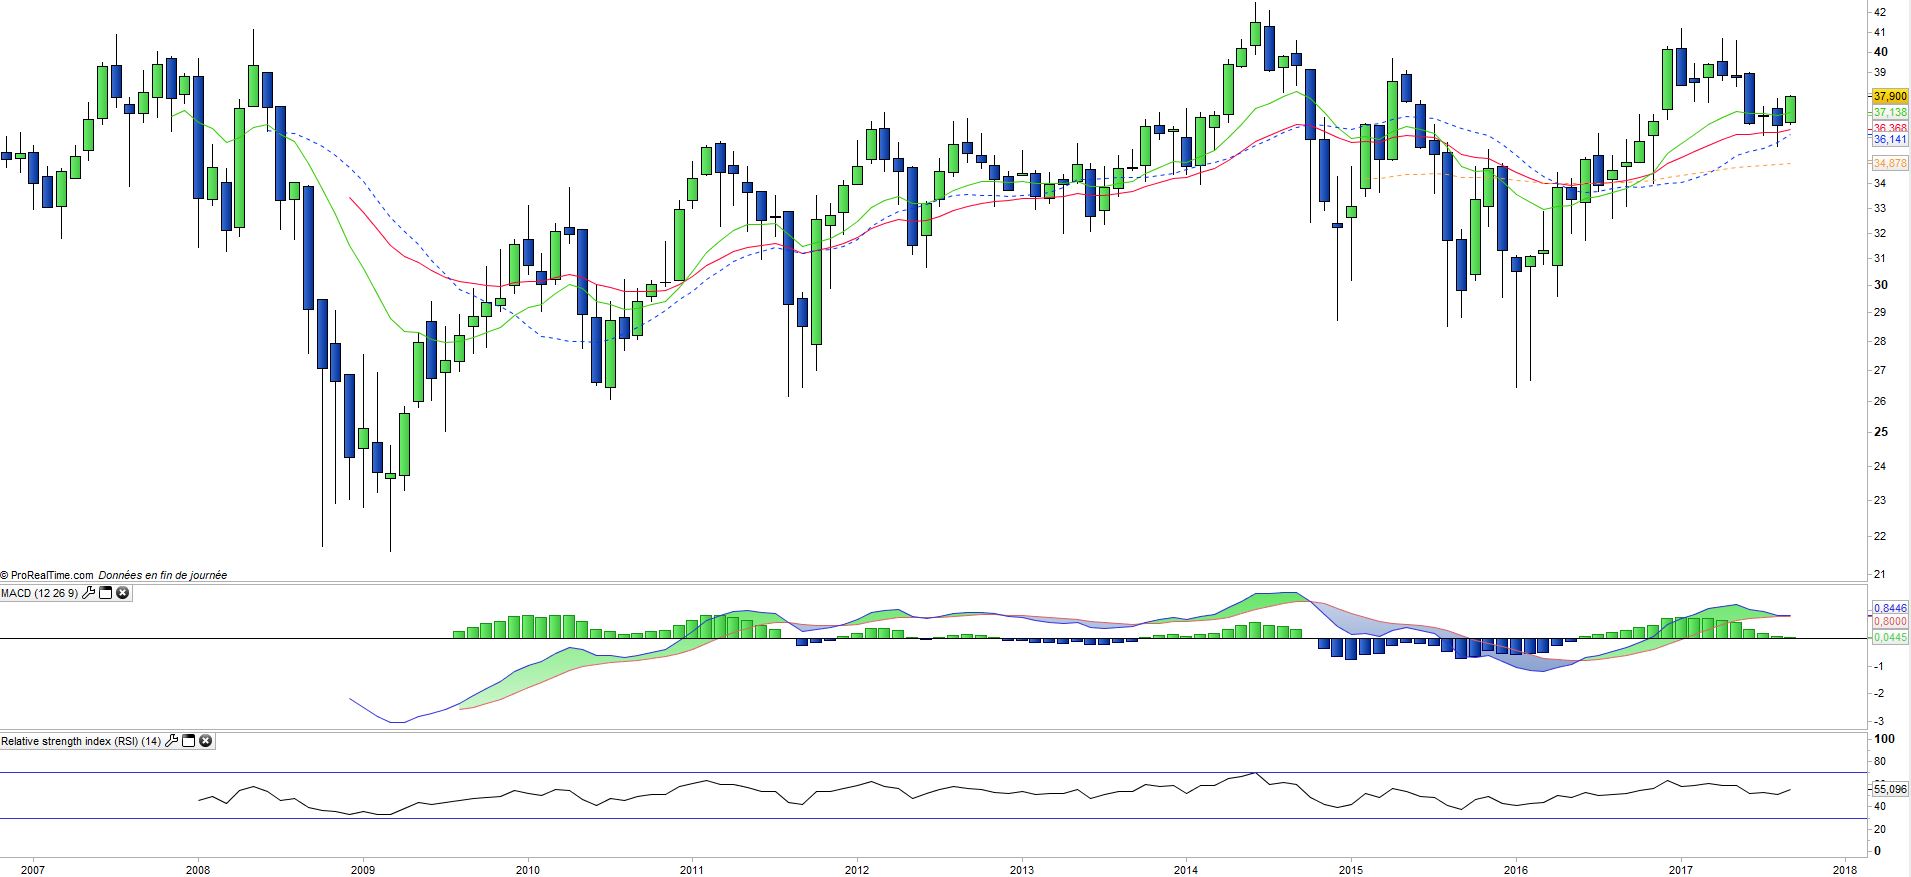
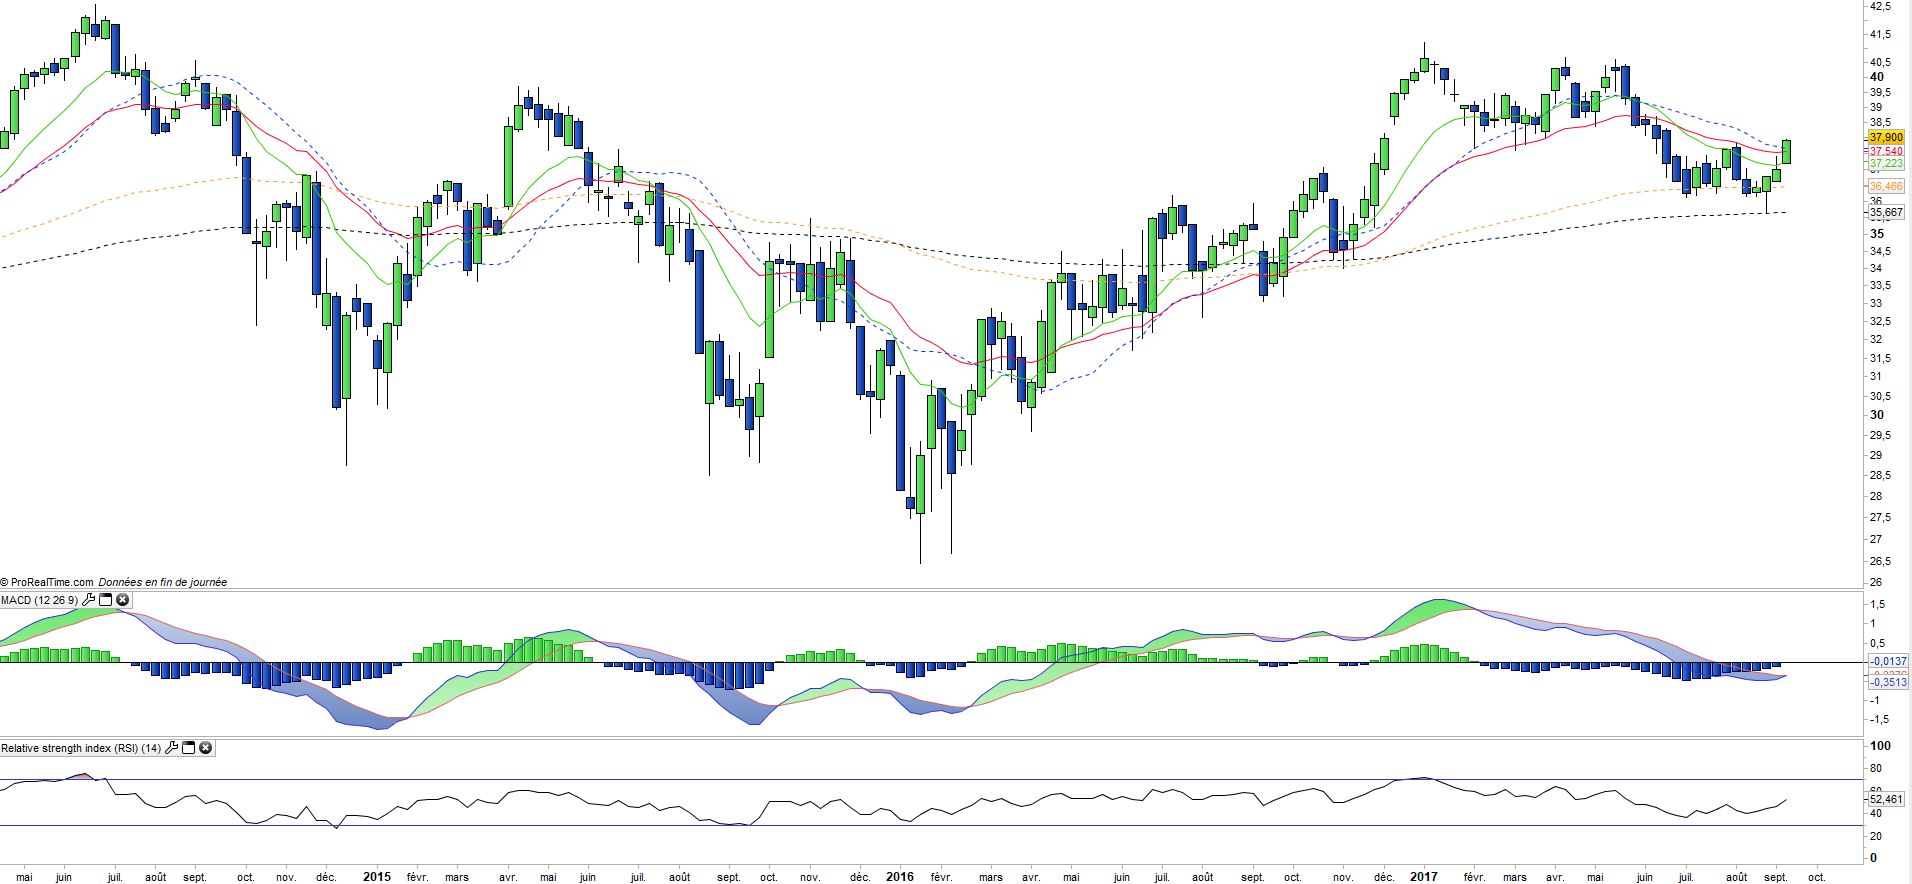
The index is quite volatile, after a sharp rise of 28.3% in 2016, the trend is much more mixed in 2017, with a 5.6% fall since the beginning of the year due to uncertainties about crude oil prices, despite a sustained global demand and OPEC's production limitation. In the short term, cyclones have had A positive impact on crude oil prices ( halt production in the Gulf of Mexico by precautionary), while the global recovery is confirmed ( + 3.5% global growth in 2017 according to the IMF) and OPEC is considering an extension of the agreement with Russia on the cuts in production. But all of this remains fragile, and the visibility of crude oil is very low. Large majors remain upbeat, benefiting from significant refining margins while continuing to refocus on shale oil. Oil, however, has no geopolitical risk premium and growing tensions between Iran and Saudi Arabia may at some point be ranimer.
The index is fairly volatile, following a strong increase of 28.3% in 2016, the trend is much more mixed in 2017 with a 5.6% drop since the beginning of the year due to uncertainties on crude oil prices despite sustained global demand and OPEC's cut in production. In the short term, hurricanes have had a positive effect on crude oil prices (halting production in the Gulf of Mexico as a precautionary measure), while the global recovery is confirmed (+ 3.5% global growth in 2017 according to IMF) and that OPEC is considering an extension of the agreement with Russia on production cuts. But all this remains fragile, and visibility on crude prices is very low. The large majors remain fairly well oriented, benefiting from significant refining margins while continuing to shift towards shale oil. Oil prices, however, does not benefit from any geopolitical risk premium and growing tensions between Iran and Saudi Arabia could at some point revive the prices.