The ETF OIL (Lyxor) replicates the Stoxx Europe 600 Oil & Gas Index, which is composed of the main European stocks in the sector. This index is quite concentrated since it has only 23 values. By geography, the index is mainly exposed to the Euro zone with a weighting of about 29% for France, 16% for the Netherlands and 11% for Italy while the UK weighs c.20%.
The ETF OIL bears a fee of 0.3% with AUM of approximately 414M€. The replication method is indirect (via a swap) and the dividend distribution policy is capitalized.
Alternative ETF: EXH1 (iShares in Euro)
Index profile
This oil & gas index is rather concentrated since it contains only 23 stocks that are essentially large market capitalizations, while the top 3 oil majors, which represent 60% of the index, weigh around € 100bn each. Total (29% of the index), Royal Dutch Shell-A (15%) and BP (15%). The index also includes industrial stocks such as Neste Oil (refining), Technip (engineering) and Vestas (wind power). These values are linked to oil prices, but sometimes in opposite directions (refining is all the more profitable as the price of oil is low and stable), renewable energies are attractive when oil is expensive, while services oil prices are directly correlated to the price of crude and present a risk of increased volatility in a period of uncertainty both in terms of demand and supply.
The current period is characterized by an abundance of supply coming from shale oil, said "unconventional" and which has already caused a significant drop in prices since 2014. Oil prices are being pulled out of their range because of the geopolitical premium associated with the Middle East crises and the "investment gap" that results from the natural erosion of well productivity in the absence of investment coupled with a strong demand dynamic. The costs of shale actors tend to drop, but bottlenecks could emerge at a certain level of production, so the short / medium term remains rather bullish.
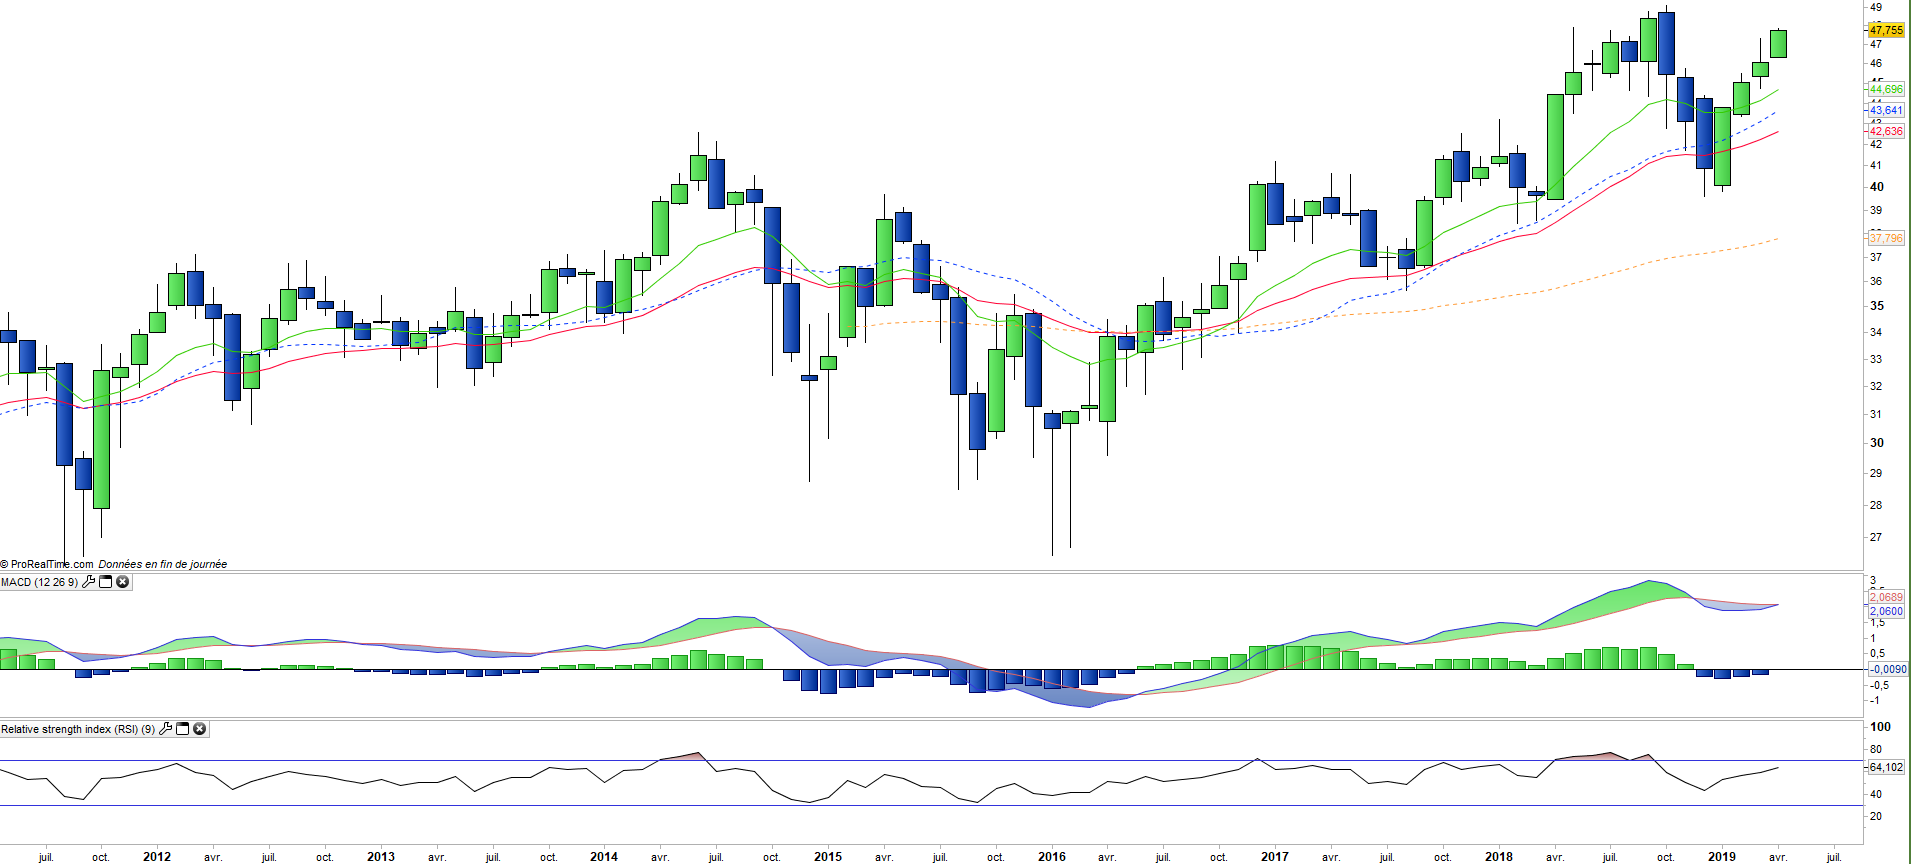
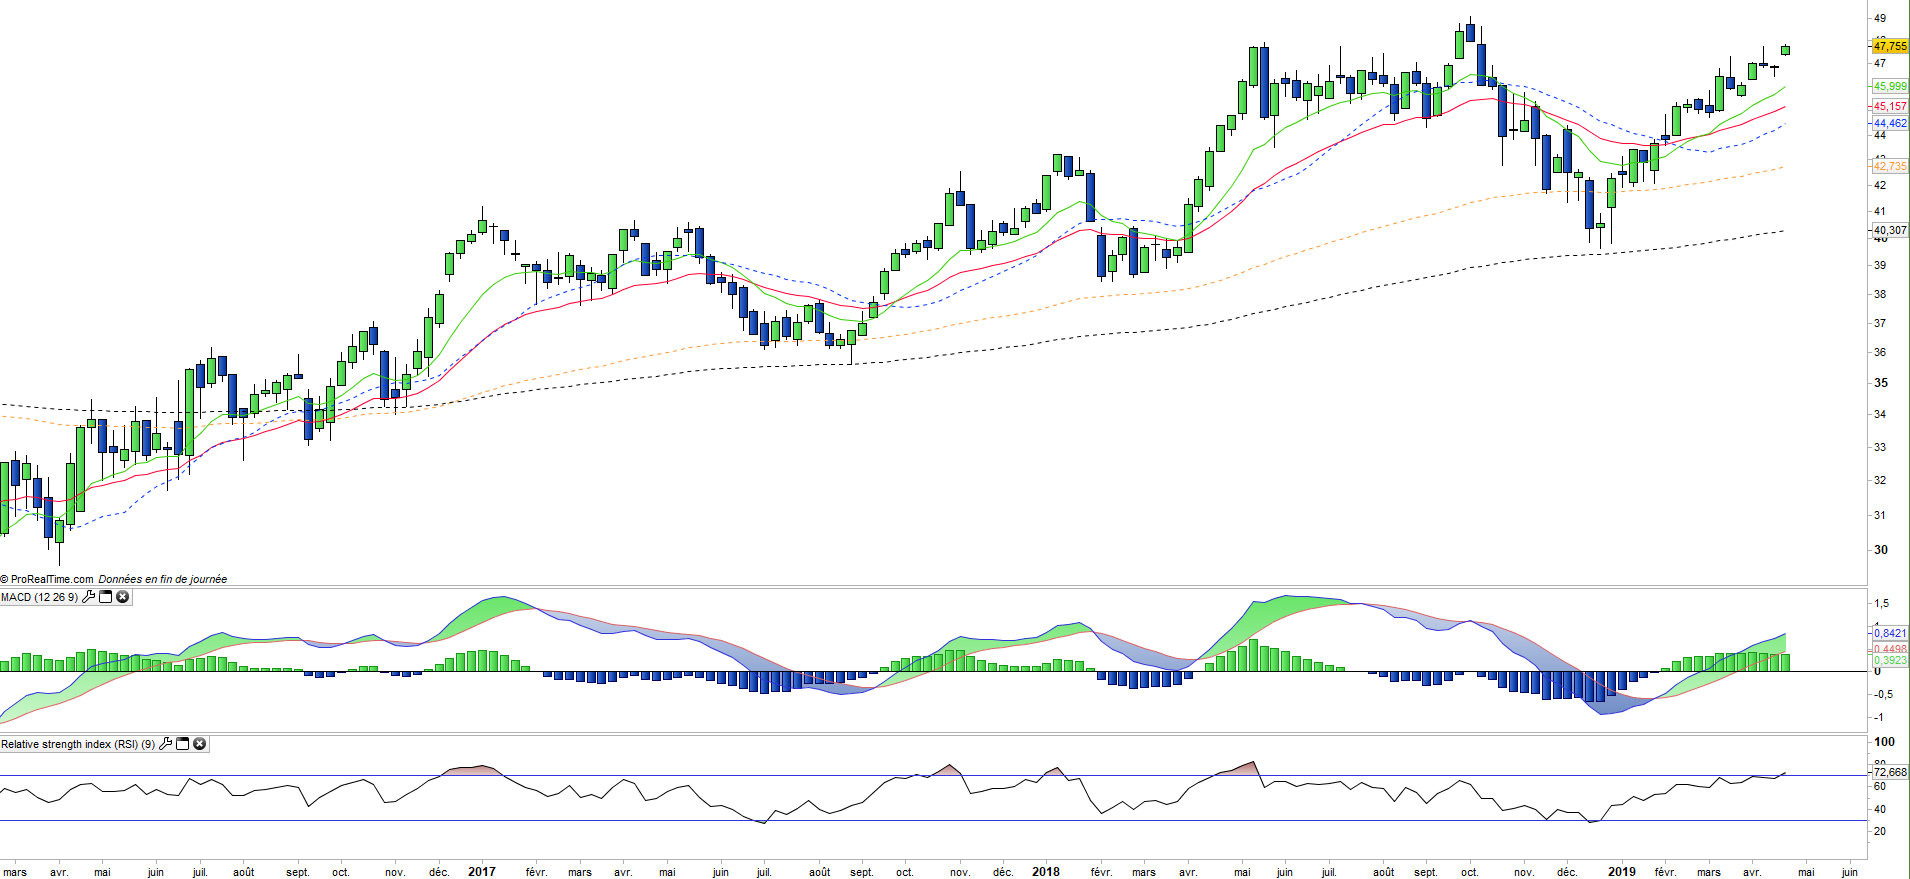
In the longer term, the electric car and the lower consumption of combustion engines should have a deflationary effect on crude prices. Major oil majors are already investing heavily in oil & shale gas, as well as in renewable energies. They should therefore continue to optimize their asset portfolios in the coming years without significant risk, while oil services players are much more exposed. The OIL index has risen by around 16% since the beginning of the year, in line with the Stoxx600NR, which is linked to the rise in crude prices, fueled by the growing tensions with Iran - reinforced after the decision of D.Trump to punish any import of oil to Iran- and Venezuela.
The "investment gap" noted by the cessation of spending majors since 2014 should also end up weighing on supply, while the growth Shale oil production can not be extrapolated due to bottlenecks and infrastructure problems. Prices should therefore in the future be increasingly dependent on demand and therefore on global growth.