S&P500 index: Correction so far under control?

S&P500 index - 20/05/19

Short Term trend: Positive (70/100)
Long Term trend: Positive (95/100)

Scores computed by our proprietary algorithms - cf methodology

Index profile

The top 10 stocks of the S & P500 include five major technology stocks (Apple, Amazon, Microsoft, Alphabet and Facebook), but also larger, more classic and iconic American companies such as JP Morgan or Exxon Mobil.

The main benefit of this index is its depth, which allows it to be a good proxy for the US economy, with a sector weighting that favors the growth sectors a little more, just like the technology stocks that represent about 20% of the weighting.

Financial stocks account for just over 13% of the index and energy stocks around 5% are well balanced by defensive sectors such as health (around 15%) and consumer discretionary (10%).

After a 19.4% rise in 2017, the S & P500 posted a 6.2% drop in 2018 due to expectations of an economic downturn related to the worsening trade war between the US and China and a at the same time, interest rate increases by the FED.

The index rebounded 14% in 2019 due to a change of course of the FED which no longer plans to raise rates in the short term, and business results that were rather reassuring in the first quarter coupled with reasonable growth prospects in 2019.

However, the reactivation of the trade war with China raises the risks on the global economy, while the FED could be more accommodating.

The S&P500 is fairly valued at 18x ​​earnings, leaving little room for growth for expected earnings growth of +5% this year.

Instruments: SPY (SPDR in USD), SP5 (Lyxor in Euro), IVV (iShares, in USD)

Technical Analysis

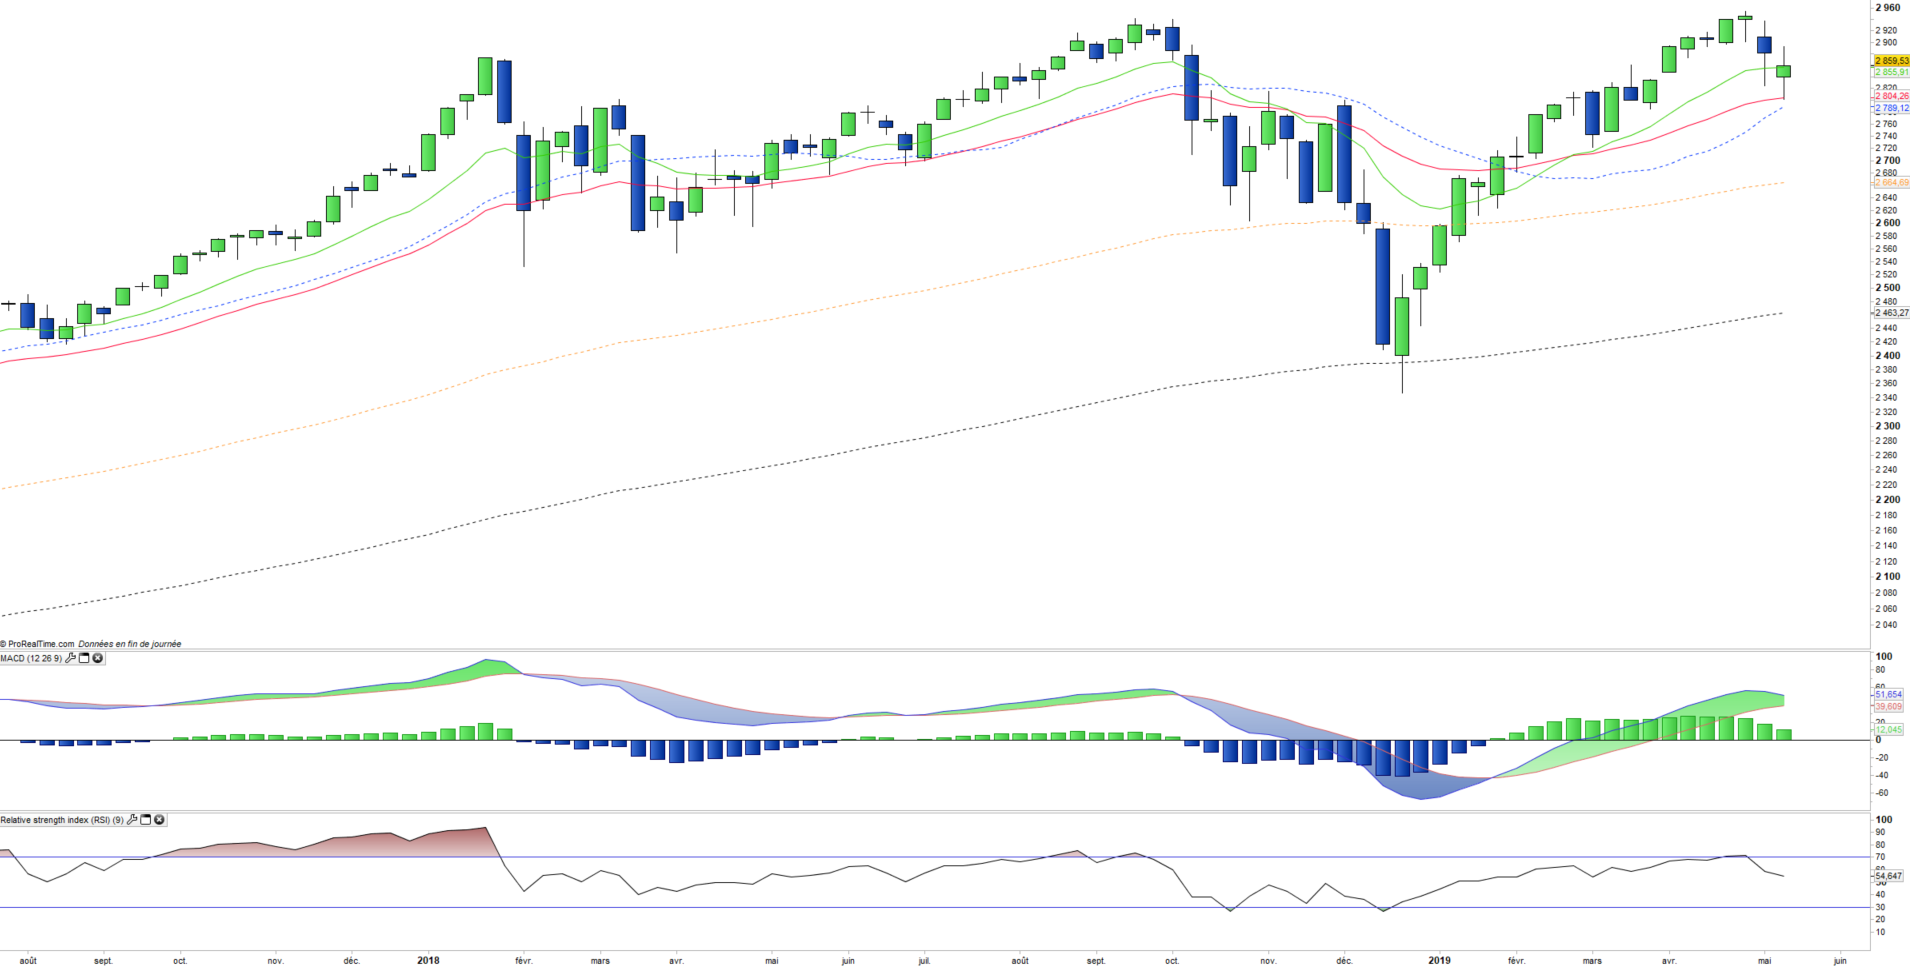
Weekly data analysis:

The weekly chart shows a short-term, low-intensity correction that reached supports formed mainly by EMAs 20 and 26. A rebound attempt is likely from these levels, especially since the technical situation is not too degraded. However, it could become so if the rebound fails or is slow to materialize. Oscillators could turn around, and the MACD could cross lower, which is often a harbinger of a medium-term corrective period.
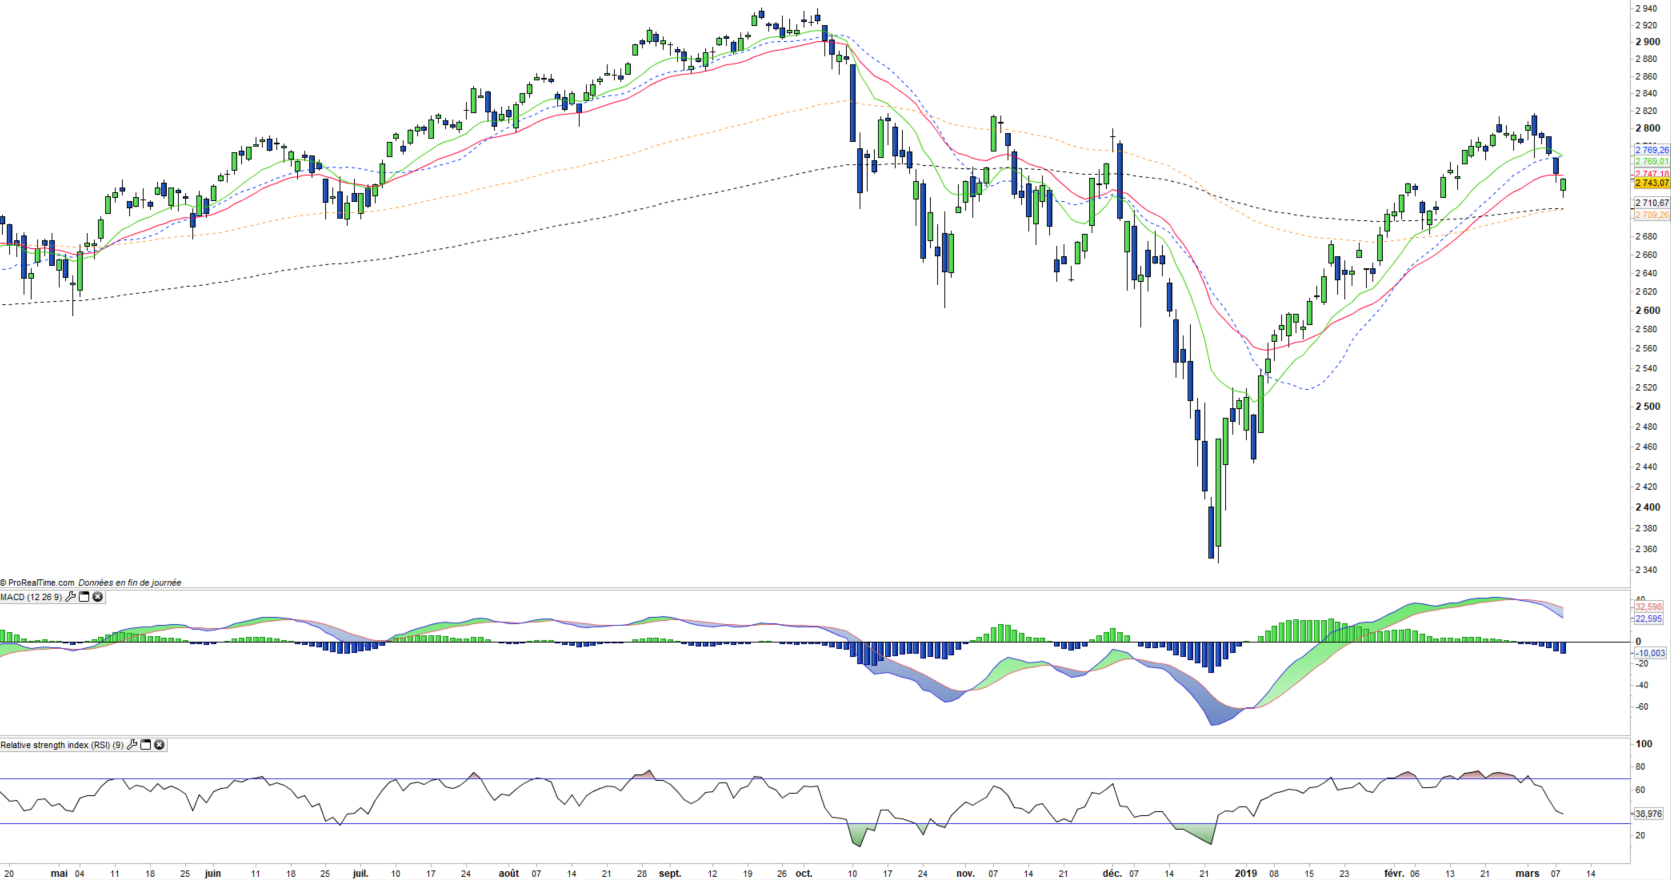
Daily data analysis

On the daily chart, we can visualize the current rebound attempt that is currently unable to reverse EMAs12 and 26 upwards. A re-test of the EMA100 is possible in the short term, before a more credible rebound attempt. The EMAs100 and 200 just below 2774pts are the mainstays of the short-term trend. A confirmed sink of these levels would imply a change of direction of the trend in the short  and medium term.

Country Breakdown

USA 100%

Sector Breakdown

Information technology 21%
Health Care 14%
Financials 13%
Consumer discretionary 10%
Communication Services 10%
Industrials 9%
Consumer Staples 7%
Others 14%

Top Ten Holdings

Microsoft  4%
Apple 4%
Alphabet 3%
Amazon 3%
Johnson & Johnson 2%
Facebook 2%
Berkshire Hathaway 2%
JPMorgan Chase & Co 2%
Exxon Mobil 1%