USS&P500 : Back to the mean?

US S&P500 - 22/07/19

Short Term trend: Positive (90/100)
Long Term trend: Positive (100/100)

Scores computed by our proprietary algorithms - cf methodology

Index profile

The top 10 stocks of the S&P500 include five major technology stocks (Apple, Amazon, Microsoft, Alphabet and Facebook), but also larger, more classic and iconic American companies such as JP Morgan or Exxon Mobil.

The main benefit of this index is its depth, which allows it to be a good proxy for the US economy, with a sector weighting that favors the growth sectors a little more, just like the technology stocks that represent about 26% of the weighting.

Financial stocks account for just over 16% of the index and energy stocks around 5% are well balanced by defensive sectors such as health (around 14%) and consumer discretionary (10%).

After a 19.4% rise in 2017, the S & P500 posted a -6.2% drop in 2018 due to expectations of an economic downturn related to the worsening trade war between the US and China and a at the same time, interest rate increases by the FED.

The index rebounded 18.7% in 2019 due to a change of course of the FED which envisages lowering rates to support the economy and massive share buybacks of companies that support earnings per share.

However, the reactivation of the trade war with China raises the risks to the global economy, not to mention a risk of conflict in the Middle East.

The S&P500 is well valued at 17x earnings, leaving little room for disappointment over corporate earnings growth over the next 12 months.

Instruments : SPY (SPDR in USD), SP5(Lyxor in Euro), IVV (iShares, in USD)

Technical analysis

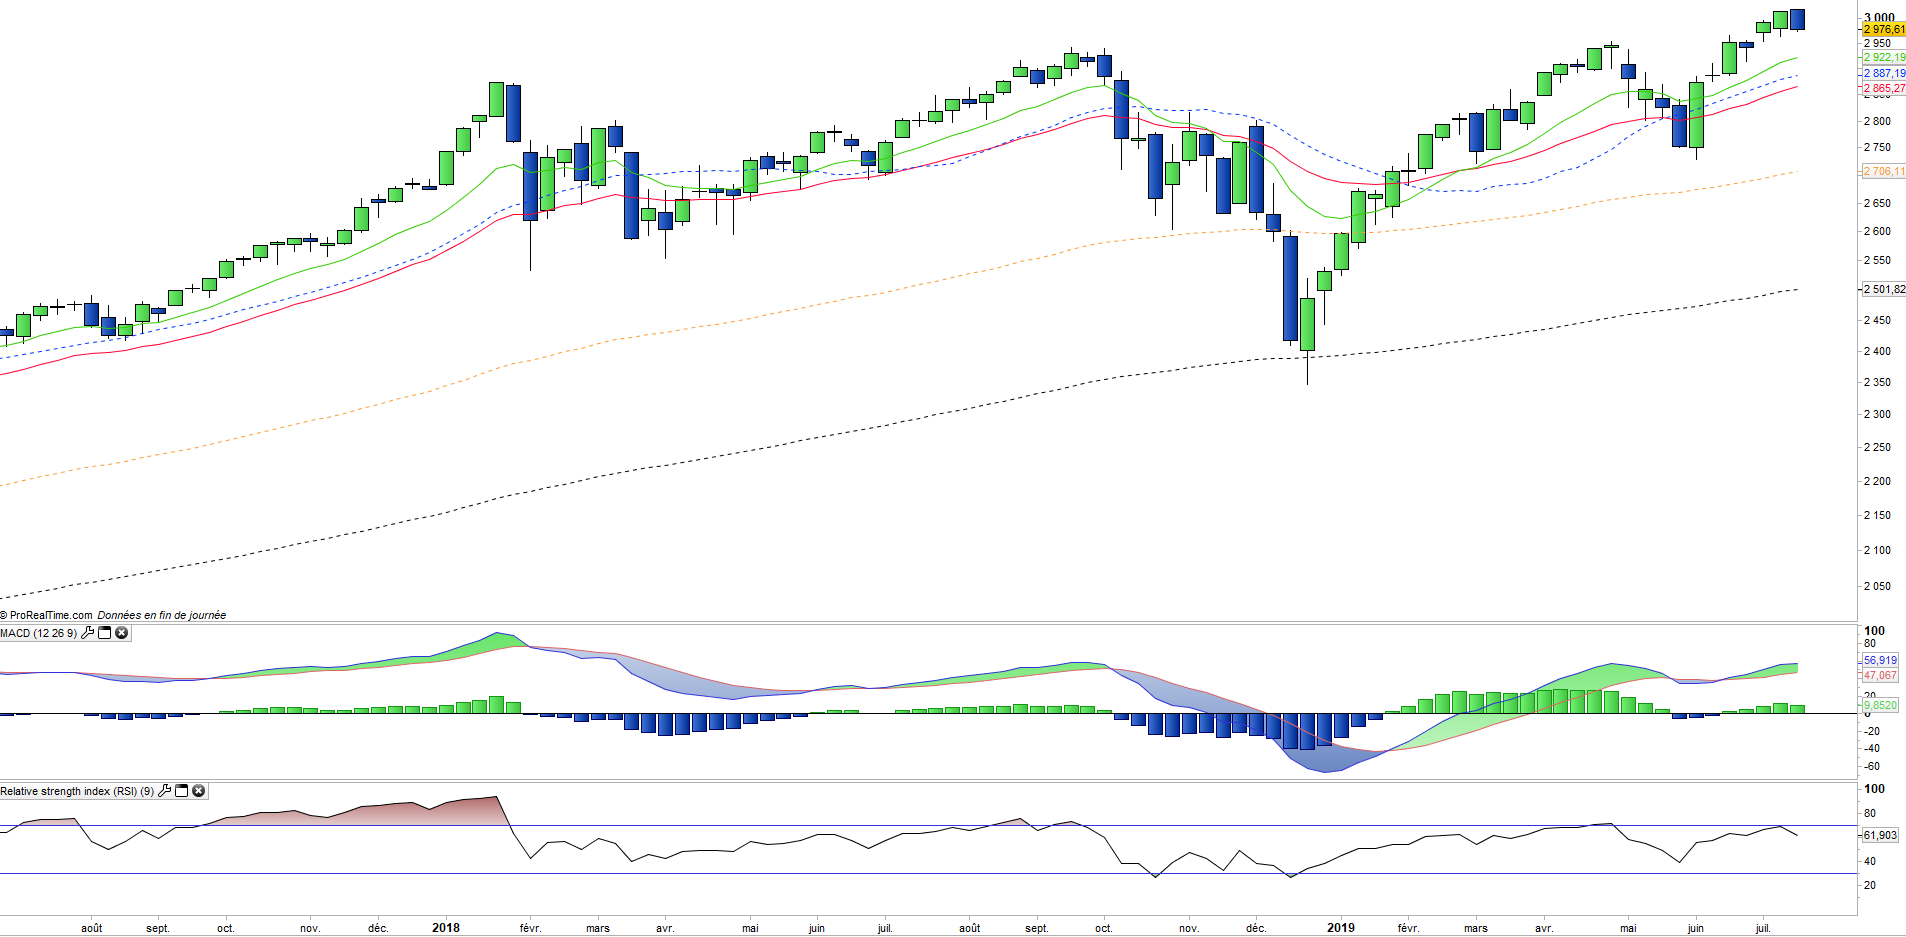
Weekly data analysis

The weekly chart shows an index that has just achieved historical highs but is struggling to leave the area of 2900/3000 pts. A downward bearish ungulfing at the weekly level is fearing a limited correction (return on the EMA12 or 26) from current levels, while the trend remains clearly bullish on all technical indicators.
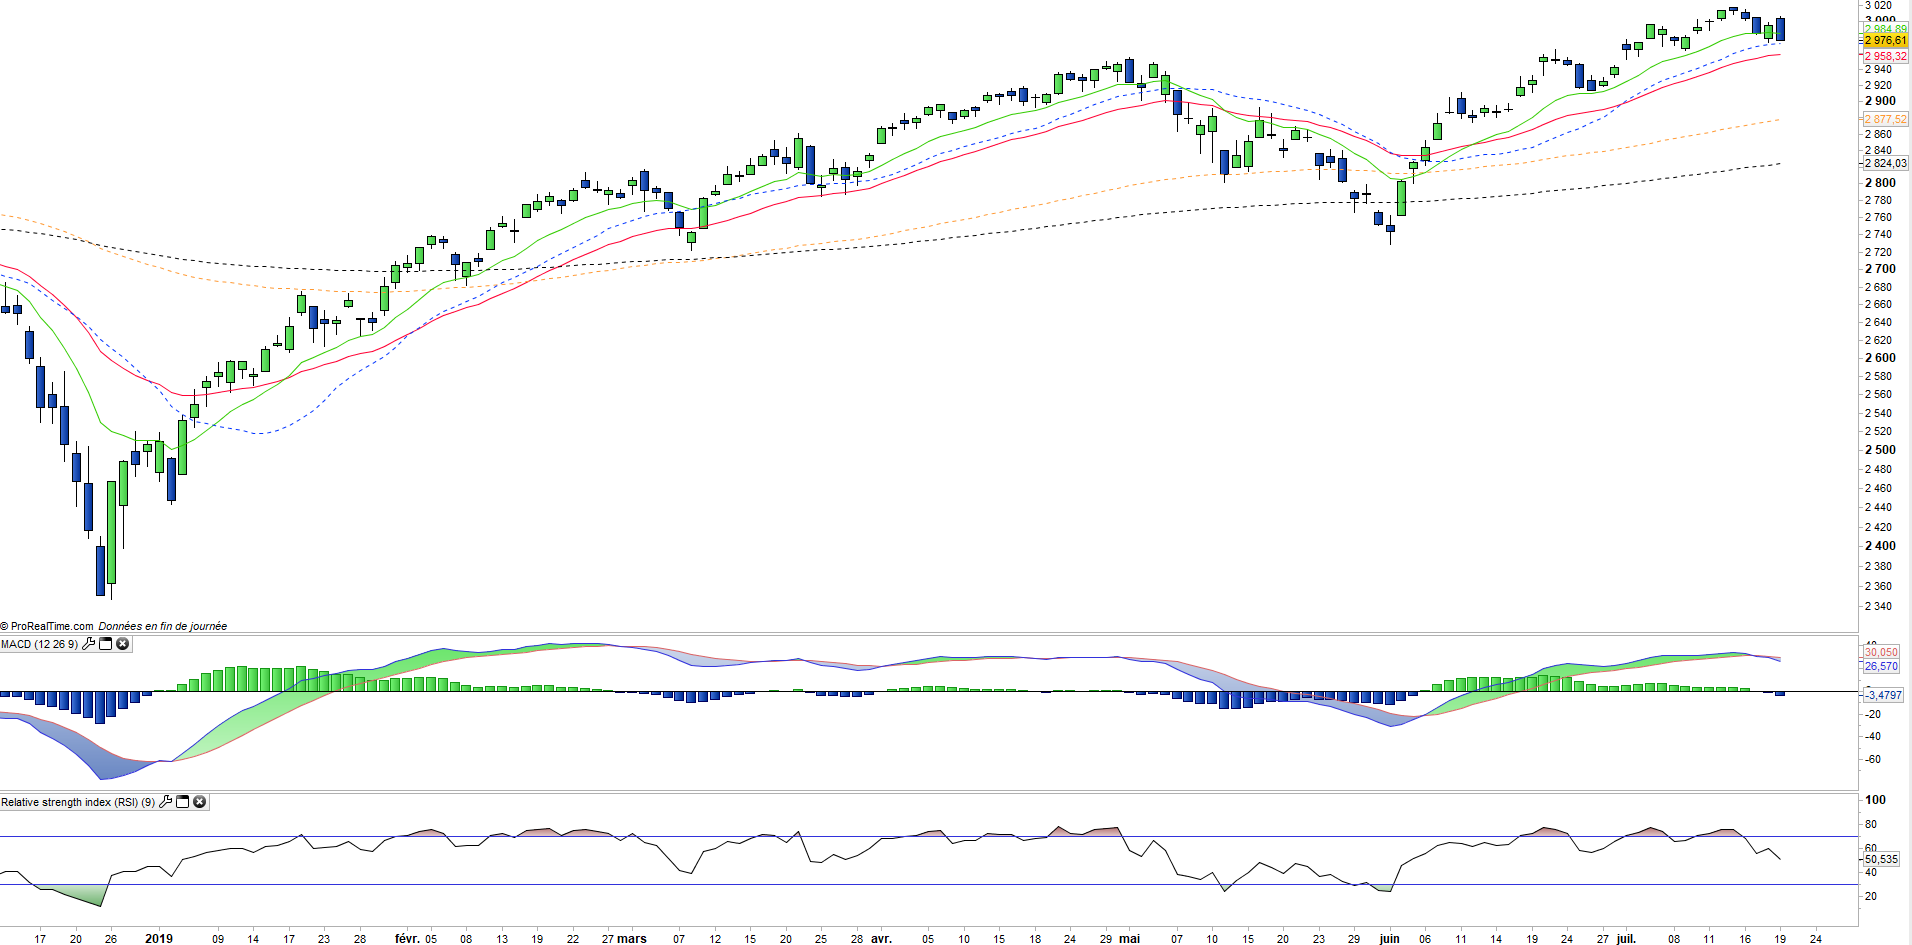
Daily data analysis

On the daily chart, we can observe the negative cross of the MACD followed by the other technical indicators, which seem to indicate the beginning of a consolidation after a wave of uninterrupted increase since June which brought to a progression of + 10% on the index. It remains to be seen what potential for this correction. The EMA100 located 100pts below current levels (thus 3-4%) seems to be a first realistic goal.

Country breakdown

USA 100%

Sector breakdown

Information technology 22%
Health Care 14%
Financials 13%
Consumer discretionary 10%
Communication services 10%
Industrials 9%
Consumer staples 7%
Others 14%

Top ten holdings

Microsoft  4%
Apple 4%
Alphabet 3%
Amazon 3%
Berkshire Hathaway 2%
Facebook 2%
Johnson & Johnson 1%
JPMorgan Chase & Co 1%
Exxon Mobil 1%