SPDR SP500 Metals & Mining (XME) - 05/06/2018
Short Term strategy: Positive (100%) / Trend +
Long Term strategy: Positive (100%) / Trend +
Characteristics of the ETF
The XME ETF (SPDR) created in 06/2006 is listed on the Nyse in USD, and replicates an index based on a selection of 29 US mining stocks. The tracked index is the S & P Metals & Mining Select Industry Index. It is a very specialized index from a geographic point of view, composed mainly of American mining stocks and quoted in USD. The fee for this ETF is 0.35% and the AUM are approximately $ 996M. The replication method is direct (physical) and there is a quarterly dividend distribution policy.
Alternative ETFs: PICK (iShares in USD), COPX5 Global X in USD)
Latest developments
After an increase of 19.6% in 2017 (and 103% in 2016), the performance of XME is + 4% since the beginning of the year, which is higher than the S & P500 (+ 2.3%).
The main reason for this dynamism is linked to the Trump administration's policy of setting up customs barriers on European, Russian, Canadian, Japanese and Chinese steel and aluminum manufacturers. Thus, the US steel and mining industry is the main beneficiary of this protectionist policy, which should have a significant effect on the margins of companies in the sector.
Commodities are benefiting from the acceleration of the global demand (Chinese and Indian in particular) which should pull prices up. In addition, some metals may be more structurally growing because of their greener nature, such as aluminum, which is recyclable, or copper, which should benefit from the rise of the electric car in China, while steel is more cyclical and relies heavily on the automotive and construction sector.
Index & components
XME includes 29 US companies in the mining sector, whose average market capitalization is $ 5 billion.
For the sub-segments of activity, the most important is steel (50.3%), followed by coal and fuel (13.2%), aluminum (10.4%), gold (10.6%), silver (7.4%) and copper (4.4%). It is therefore a fairly concentrated index in terms of the number of stocks, and fairly diversified in the underlying industries, despite the predominant share of steel. XME is equal-weighted, which makes it possible to better diversify the exposure, between large caps and small caps but also according to mineral specializations.
After several years of decline, commodity prices began to recover in early 2016, due to announcements of Chinese capacity reductions (mainly steel and aluminum) and a wave of optimism around the victory of Donald Trump in the US presidential elections, tied to the promise of a major infrastructure program and lower taxes, as key triggers. Iron ore has risen sharply in the first few months of 2017, which is related to Western anti-dumping measures that have been incorporated by China. In addition, copper is now at its highest for two years, and reached $ 7000 per ton, taking advantage of optimistic prospects on the world economy and in particular Chinese. In addition, China may also prohibit the import of scrap metal from certain metals, which would increase the demand for refined copper.
XME is an extremely volatile medium, which is very sensitive to variations in demand, and therefore to global growth, but also to supply adjustments. The return to a more inflationary environment is a positive factor for the sector. Diversification is at the heart of the strategy of the major mining companies who wish rather to develop capacities in sectors of the future (Aluminum, Copper ...) and to reduce them in sectors in difficulty (Coal ...).
The sector depends on two main factors that are the demand, especially for infrastructure mainly from China and the US, but also from major emerging countries such as India, but above all capacities so far bloated especially for Chinese steel. The scenario of a drastic decline in Chinese capabilities does not seem to be on the agenda, especially in the iron ore in which US companies are highly exposed.
The current situation is therefore very much due to the dynamics of demand, and therefore to China's monetary support for its economy (real estate / construction in particular), which may seem a bit fragile despite the ongoing reflation of the world economy. The theme of the world economy’s reflation is positive for commodities and for the mining sector, which explains the good recent performance.
Monthly data
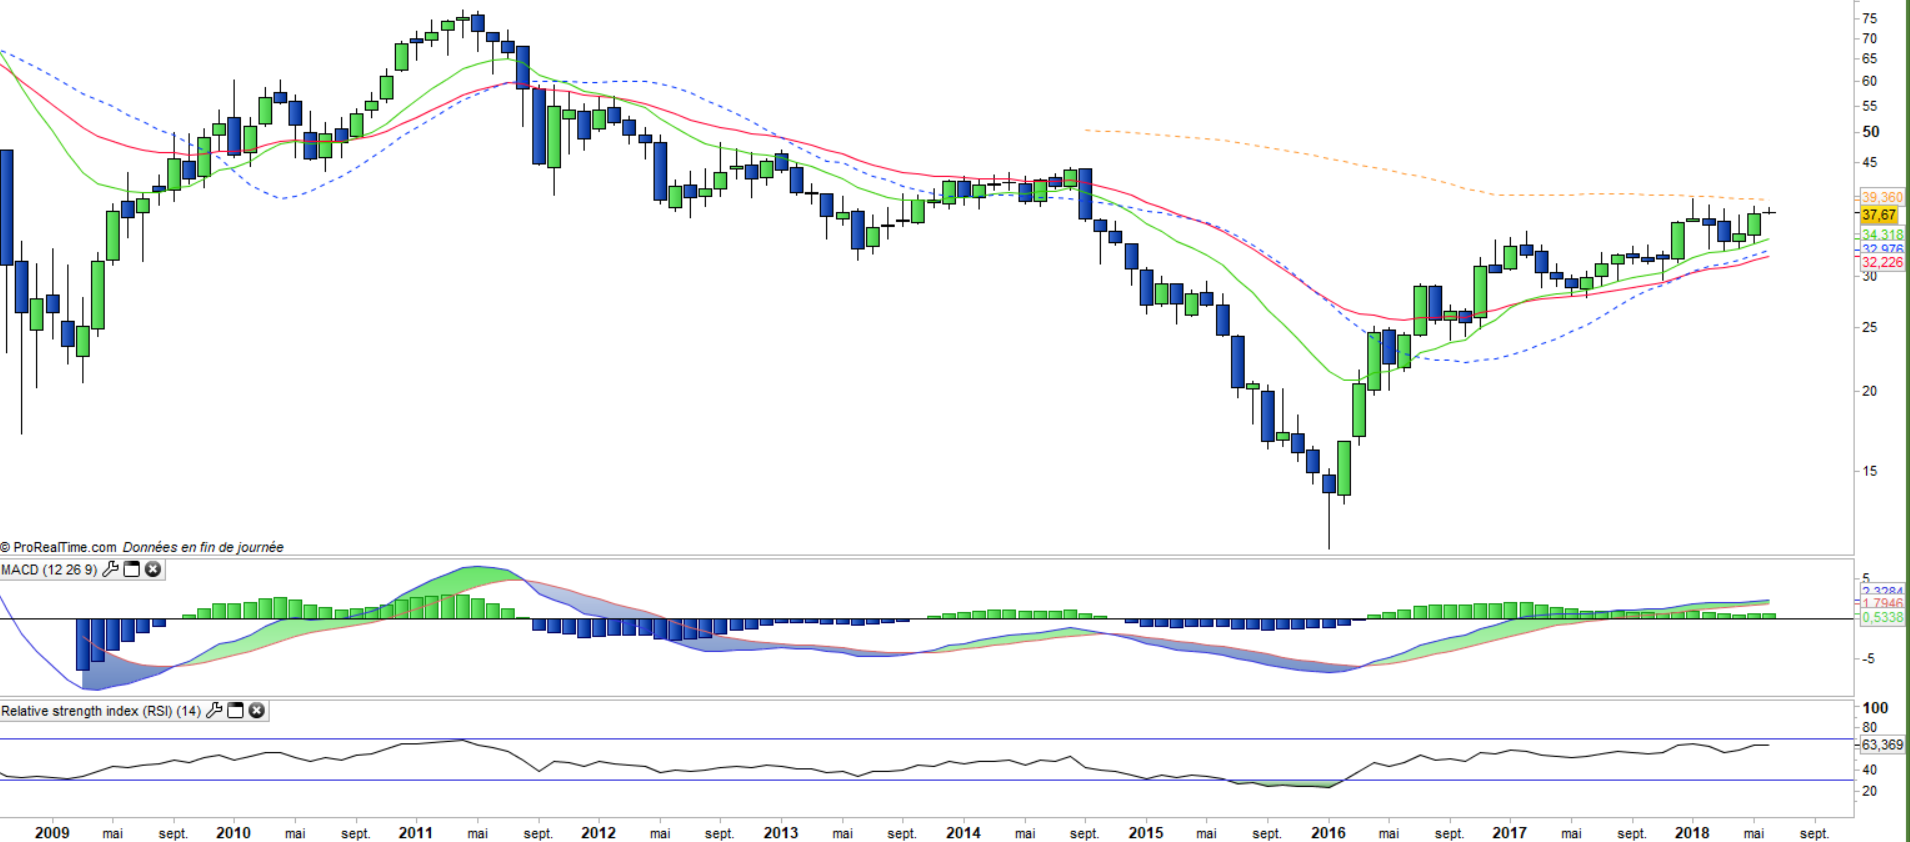
On the monthly chart, we can see that the upward trend change that occurred in 2017 is gradually increasing in power without causing any particular overheating on the technical oscillators. Exceeding the EMA100 is not a trivial event and reinforces the general impression of strengthening the trend.
Weekly data
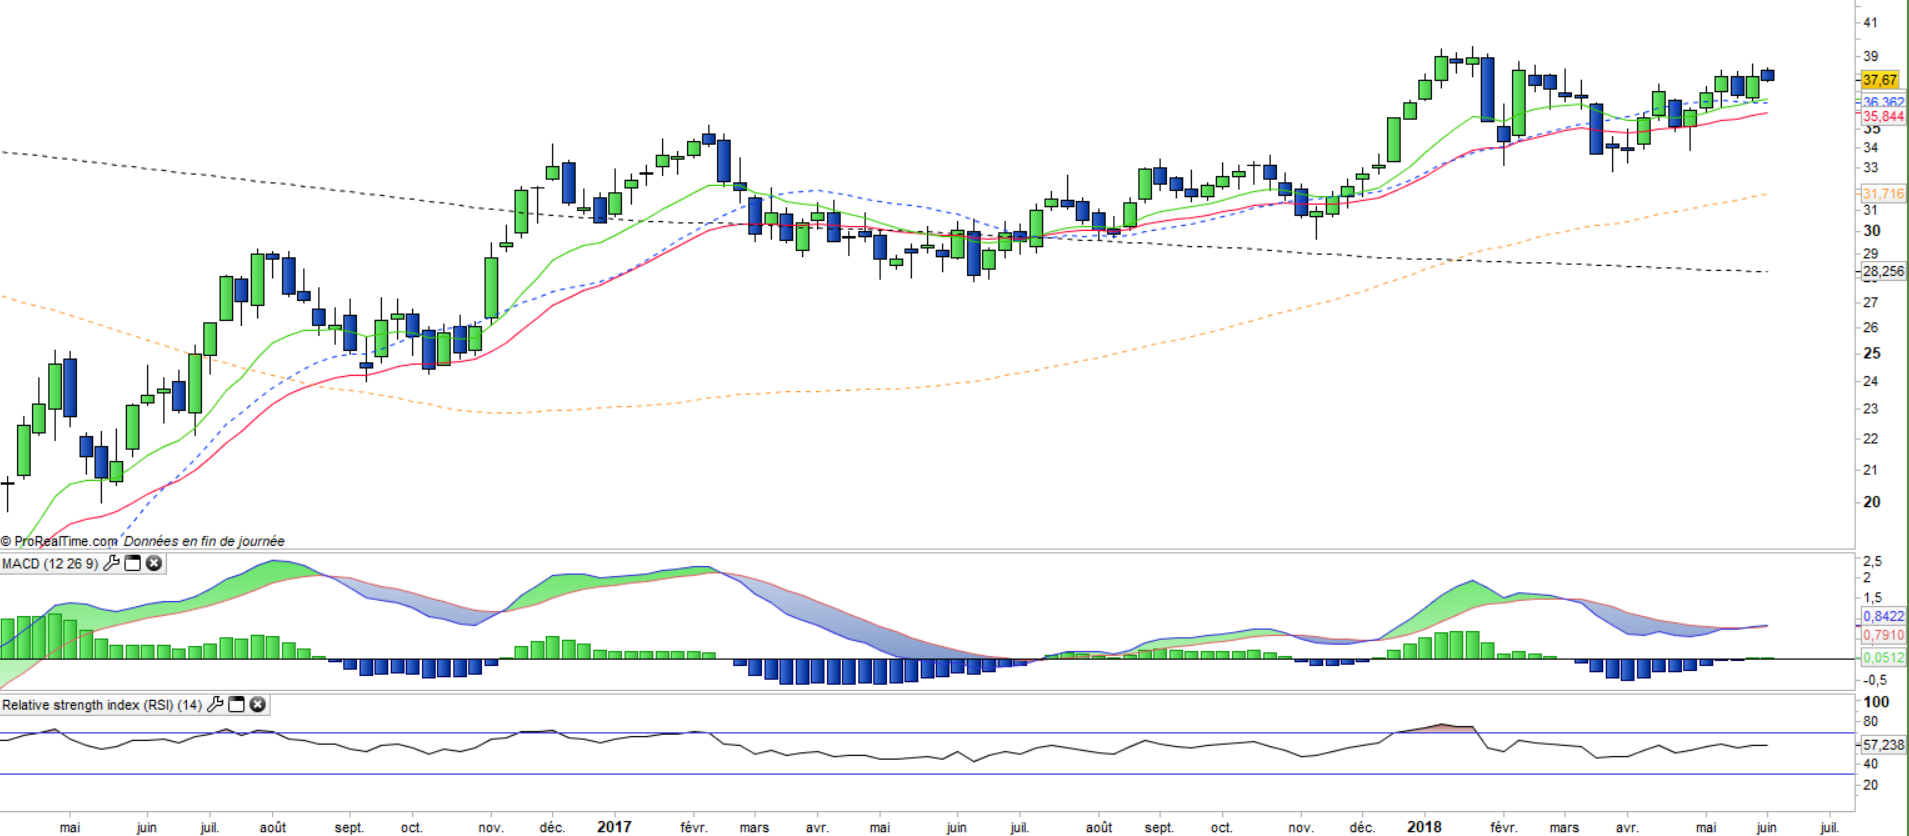
The weekly chart shows an uptrend that is growing positively, with an increasingly steady rise. The current rebound forms a rather positive rounded structure that should lead to new highs. The MACD has just turned upwards while staying above the zero line. An acceleration is likely.
ETF Objective
XME is an ETF listed in $, which seeks to replicate the S&P Metals & Mining Select Industry index (29 US companies)
Characteristics
| Inception date | 19/06/2006 |
| Expense ratio | 0,35% |
| Issuer | SPDR |
| Benchmark | S&P Metals & Mining select industry |
| Code / Ticker | XME |
| ISIN | US78464A7550 |
| UCITS | No |
| Currency | $ |
| Exchange | NYSE Arca |
| Assets Under Management | 997 M$ |
| Dividend | Distribution |
| Currency Risk | No |
| Number of Holdings | 29 |
| Risk | 4/5 |
Country Breakdown
| USA | 100% |
Sector Breakdown
| Steel | 50% |
| Coal & Consumable fuels | 13% |
| Gold | 11% |
| Aluminum | 10% |
| Silver | 7% |
| Copper | 5% |
| Diversified Metals & Mining | 5% |
Top Ten Holdings
| Peabody Energy Corporation | 5% |
| Cleveland-Cliffs Inc | 5% |
| Royal Gold Inc. | 5% |
| Steel Dynamics Inc. | 5% |
| Newmont Mining Corporation | 5% |
| Reliance Steel & Aluminum Co. | 4% |
| Allegheny Technologies Inc | 4% |
| Alcoa Corp | 4% |
| Nucor Corporation | 4% |
| Commercial Metals Company | 4% |