Index profile
The FTSE100 index is quite deep, and above all fairly balanced from a sectoral point of view.
However, we note the particularity of a significant weighting in the commodities sector since all the oil & gas + mining sectors represent 27% of the index (compared to 6% for the stoxx600), more than the financials (21%) and durable goods (16%). The health sector is also very important and represents 9% of the index. All this implies that the FTSE 100 is very "dollarized" because the revenues of these companies are usually made largely in the US currency, which is not trivial either given the potential amplitude of the change in the USD/Euro.
If the "Brexit" has not turned into financial stress or bank or stock market panic, it must be said that the transmission belt shock was the British currency that has fallen about 20% against the Euro and to the Dollar. The effective exit of the United Kingdom, 6th world economy is still uncertain with a new limit set to 31/10/2019 its effects should be felt in the long term because it will probably require an adaptation of the English model. A further long extension of the negotiation period (with status quo preservation) is still possible, especially if the negotiations move towards an agreement, a hypothesis that does not seem to be excluded. Europe is for the moment united against England, and closes on its demands, while threats of dislocation of the United Kingdom are not very far apart (reunification of Ireland under European flag and Scottish referendum). On the other hand, the good short-term news of the fall in the pound for UK exporters has negative counterparts, such as inflation and rising interest rates, which is expected to continue according to the BOE.
The FTSE100 was down -10.9% in 2018, comparable to the Stoxx600NR (-10.6%) and rebounded 12.4%, which is lower than the rebound of 17% of the European index, which is linked to sectors more than to the English economy or brexit.
Instruments: CUKX (iShares en £), UKX (HSBC en Euro)
Technical analysis
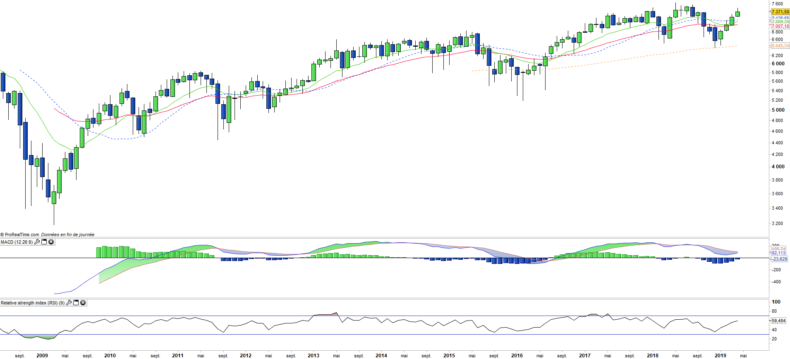
Monthly data analysis
The FTSE100 behaved quite similar to the Stoxx600, a correction that was not enough to stop the bullish momentum and a strong rebound since the beginning of the year. However, unlike the stoxx600, the English index has not yet managed to show new highs and lack of momentum. The technical oscillators are recovering but the dynamics remain moderate. The FTSE100 is less attractive than the European indices.
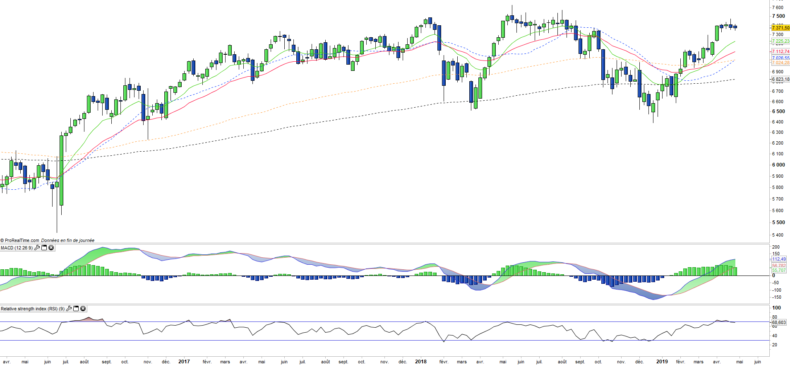
Weekly data analysis
The weekly chart shows a return of the trend in the positive zone, but the overall technical situation gives a feeling of flat structure more than bullish momentum. The EMA100 has become flat which reinforces this scenario of trading range. Only exceeding the 2018 highs would likely boost the index in a truly bullish trend.
Country breakdown
| United Kingdom | 81% |
| Netherlands | 11% |
| Switzerland | 3% |
| Australia | 2% |
| Ireland | 2% |
Sector breakdown
| Financials | 21% |
| Energy | 17% |
| Consumer staples | 16% |
| Materials | 11% |
| Industrials | 9% |
| Health Care | 9% |
| Consumer discretionary | 6% |
| Others | 11% |
Top ten holdings
| Royal Dutch Shell | 10% |
| HSBC Holdings | 7% |
| BP | 6% |
| Diageo | 4% |
| Glaxosmithkline | 4% |
| Astrazeneca | 4% |
| British American Tobacco | 4% |
| Rio Tinto | 3% |
| Unilever | 3% |


