Lyxor ETF FTSE MIB - MIB - 11/07/19
Short Term trend: Positive (100/100)
Long Term trend: Positive (100/100)
Scores computed by our proprietary algorithms - cf methodology
Characteristics of the ETF
The ETF MIB (Lyxor FTSE MIB40) created in 11/2003, quoted in Euro on Euronext, reproduces the Italian national index, composed of the 40 main Italian securities. The composition of the index is determined on the basis of three criteria: float, liquidity and the representativeness of the main sectors of the Italian market.
ETF MIB fees are 0.35%, in line with the average observed for these products and the amount under management is approximately € 403M. Replication is indirect (via swap) and there is a dividend distribution policy. This ETF is eligible for PEA.
Alternative ETFs: EWI (iShares USD), IMIB (iShares in Euro)
Index & components
This index has the particularity of being very overweight in financials which represent a third (33%) of its composition (against about 20% for stoxx600), including Intesa San Paolo, Unicredit and Generali. Other important sectors are utilities (23%), including Enel, SNAM and Atlantia, cyclical consumer goods and energy (13% each).
The 10 largest caps represent just over two-thirds of the index.
The Italian index is very volatile, given the importance of cyclical and financial sectors and the structural weakness of the Italian economy due to lack of growth, high unemployment and huge debt (132% of GDP) which regularly worries the markets.
The Italian economy has been hit hard by the financial crisis: it has contracted by more than 9% since 2007 and has faced 13 quarters of recession. Although the Italian economy has emerged from the recession since 2015, growth remains below the euro area average.
Italy made good progress in its banking restructuring in 2017 with the rescue of the Veneta banks by the State and the recovery of the assets by Intesa Sanpaolo, which followed the rescue of BMPS, as well as the refinancing of Unicredit for 13md. € in the first quarter of 2017.
Overall, structural factors (banking system reforms and labor flexibility) are taking shape, and the economic cycle is accelerating. The election of a populist government is fueling fears of a potential halt to reforms and a possible surge in the budget deficit.
The Euro / USD exchange rate remains a significant factor for the Italian economy driven by exports
Latest developments
The Italian index fell by 16.5% in 2018, significantly underperforming STOXX600NR (-10.7%) due to market mistrust of a populist government that refused to submit to the financial discipline required by Brussels, and proposed a budget that provided for a budget deficit of 2.7%. However, the Italian government finally heard reason and revised its budget and projected deficit to 2%. This turnaround has put pressure on Italy, and in particular on long-term rates, which after reaching 3.7% have now returned to 2.8%. This episode has led to a recession in Italy, but the situation seems to be recovering gradually, which translates into a 25.6% increase since the beginning of the year.
Since early June, the rebound in the Italian index has been spectacular, with a rise of 12% since early June.
We see the Buy signal on the MIB40 Italian indice as a positive for european markets. This is corresponding to the 10Y rates relapse to 1.7% in the wake of a more limited deficit (2% in 2019) announced by the government last week, a rather volatile goal but that should allow it, if it is respected, to escape Brussels sanctions.
The reversal was fueled by the Banking sector (Unicredit, ISP, Generali), which represents 33% of the indice, Utilities (Enel, Atlantia and Snam) another strong pillar (22% of the index) and Energy (ENI and Saipem) which counts for 13%. The banking sector remains pivotal for the italian indice, and the relapse of italian rates has immediate positive impacts on the banks balance sheet.
Technical analysis
Monthly data analysis
On the monthly chart, we see that the Italian index is back will rely on its monthly M26 in May and June, to better start the assault on its highs of 2018 which, towards 22 500 points, can constitute a first goal. The monthly crossing of the MACD, with its rising signal line, bodes well for the continuation of the trend.

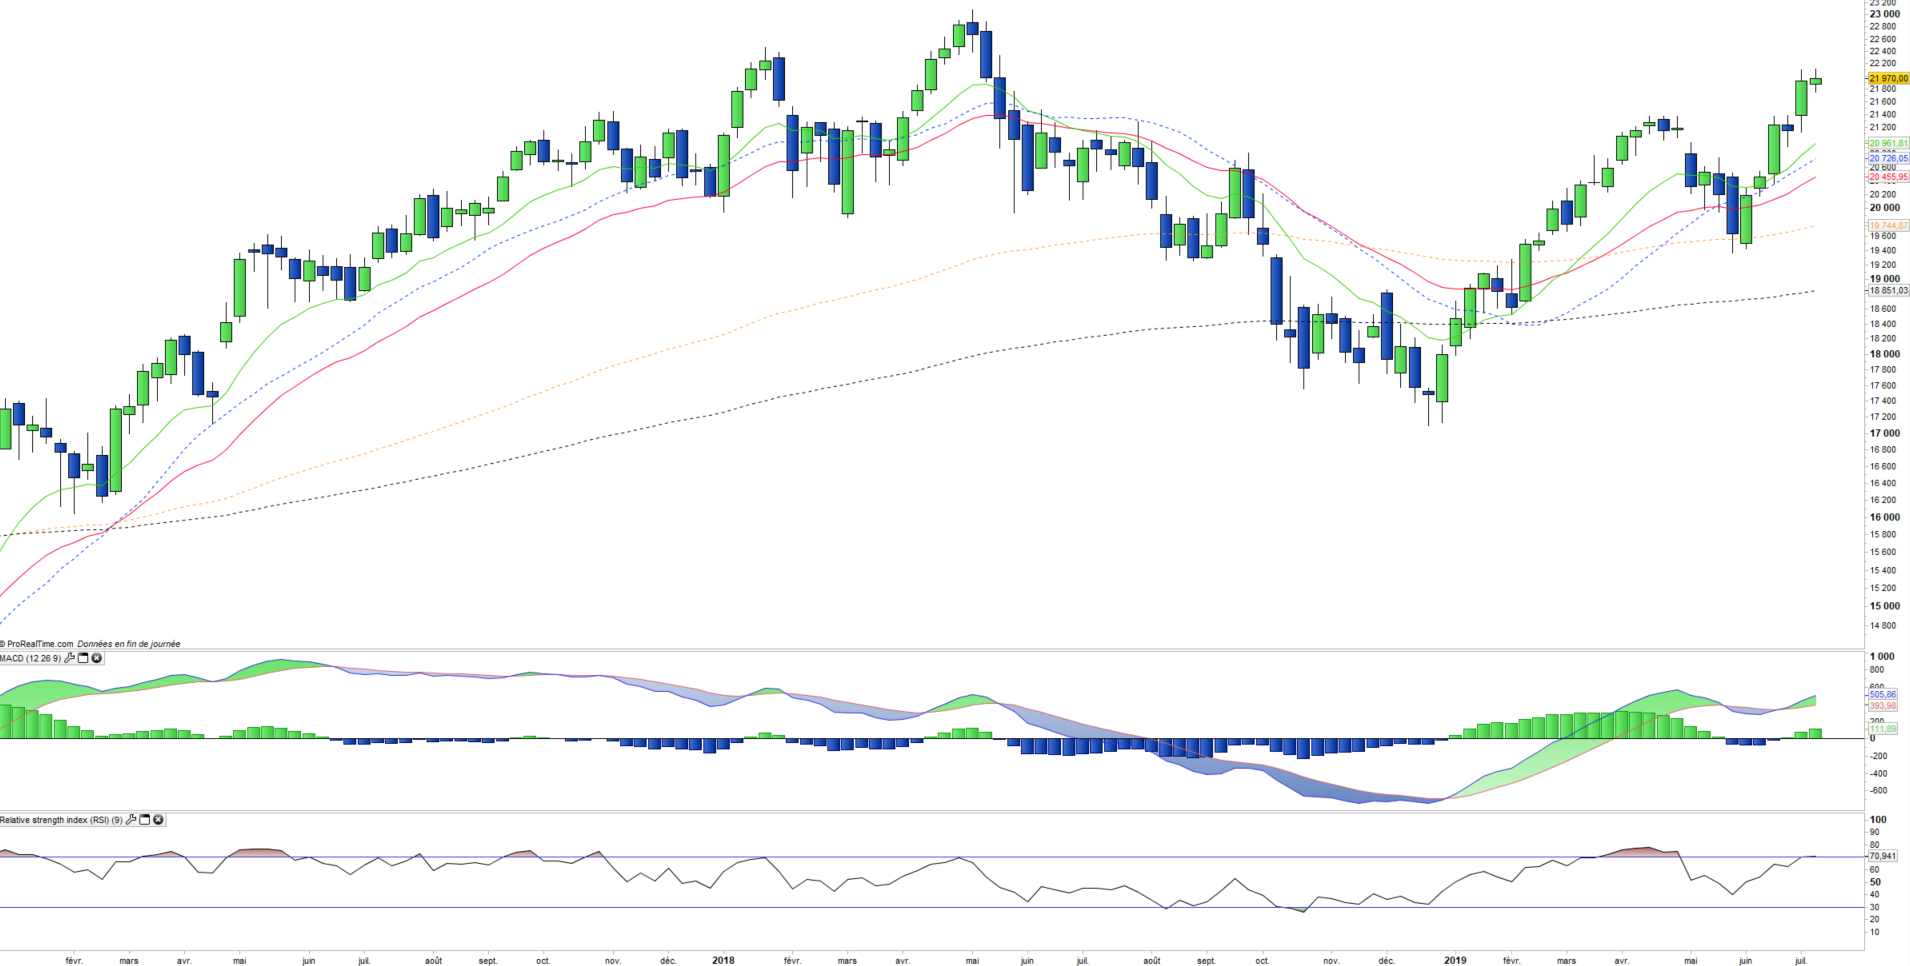
Weekly data analysis
Theme
MIB is a UCITS ETF, listed in Euro, which seeks to replicate the FTSE MIB Net Total Return index (40 italian companies)
Characteristics
| Inception date | 04/11/2003 |
| Expense ratio | 0,35% |
| Benchmark | Indice FTSE MIB |
| Ticker | MIB |
| ISIN | FR0010010827 |
| UCITS | Yes |
| EU-SD Status | Out of scope |
| Currency | € |
| Exchange | Euronext Paris |
| PEA (France) | Yes |
| SRD (France) | Yes |
| Dividend | distribution |
| Assets Under Management | 403 M€ |
| Currency risk | No |
| Number of Holdings | 40 |
| Risk | 4/5 |
Country breakdown
| Italy | 87% |
| United Kingdom | 7% |
| Netherlands | 5% |
| Luxembourg | 2% |
Sector breakdown
| Financials | 33% |
| Utilities | 23% |
| Energy | 13% |
| Consumer discretionary | 13% |
| Industrials | 9% |
| Information technology | 4% |
| Health Care | 2% |
| Others | 3% |
Top Ten holdings
| Enel | 15% |
| ENI | 11% |
| Intesa Sanpaolo | 9% |
| Unicredit | 7% |
| Assicurazioni Generali | 6% |
| Ferrari | 5% |
| Fiat Chrysler | 4% |
| Atlantia | 4% |
| Snam Spa | 3% |
| STMicroelectronics | 3% |