Nasdaq 100 - 09/09/19
Short Term trend: Positive (95/100)
Long Term trend: Positive (75/100)
Scores computed by our proprietary algorithms - cf methodology
indice profile
The interest of this index lies in the fact of taking a diversified bet but concentrated on the most beautiful technological stocks, giving a good share to the "GAFAM" (Google, Apple, Facebook, Amazon and Microsoft) which represent c.45% of the capitalization.
The index is particularly influenced by Apple's prices, which fluctuate according to the success of its new smartphones.
Note that large technology stocks have generally performed very well in 2017 and H118, especially GAFA but also semiconductors and Microsoft, but experienced a sharp correction in the last quarter 2018.
The volatility of the index is historically not very marked (despite current high volatility), which reflects the considerable weight of market capitalizations often above $ 300 billion for the top 10 companies, see $ 500 billion for the top 5. But the Nasdaq 100 is not just about its top 10 stocks, and the depth of the index makes it possible to invest in companies that are already established but still have a strong appreciation potential like Tesla, Xilinx, Symantec or the US biotech sector.
The hegemonic position of the GAFA in the world begins to provoke reactions, especially in Europe, both on competitive positions or abuse of dominant positions could trigger heavy fines, as for Google but also on taxation while European countries seek to find an agreement to tax the revenues generated on their territory. Chinese competitors are becoming more and more present, such as Alibaba or Tencent, and could soon threaten the supremacy of the leaders of American technology.
The Nasdaq100 ended the year 2018 down -1%, due to a strong end-of-year correction fueled by tensions between China and the US and the monetary policy of the FED. The year 2019 looks like 2018 with a very strong start in the first half, followed by a consolidation this summer due to the worsening trade dispute between the US and China. At the same time, the Fed has not confirmed that a trend of lower interest rates has been triggered and the consensus of EPS seems too optimistic for 2020.
Instruments : QQQ (Powershares in USD), ANX (Amundi in Euro), UST (Lyxor in Euro), CNDX (iShares in USD)
Technical analysis
Weekly data analysis
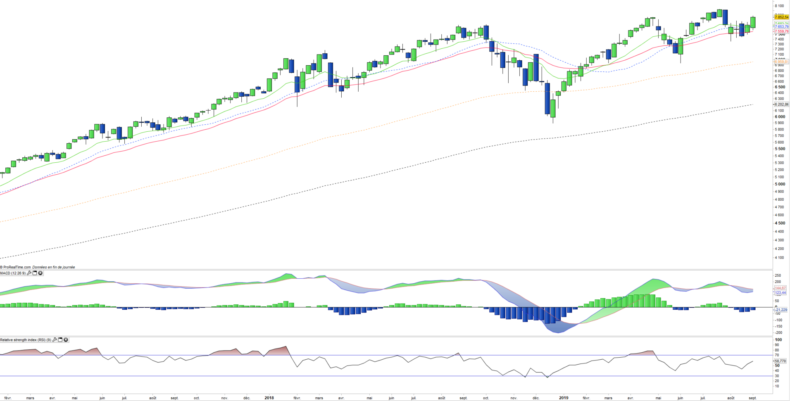
The weekly chart shows an impulse rebound on the MME26 that appears to end the correction initiated in early August. This rebound can also be observed on the technical oscillators which turn upward. However the index is close to the major resistance of 8000 pts, the bullish momentum could therefore be faced quickly difficulties, especially as the index is struggling to achieve new significant highs.
Daily data
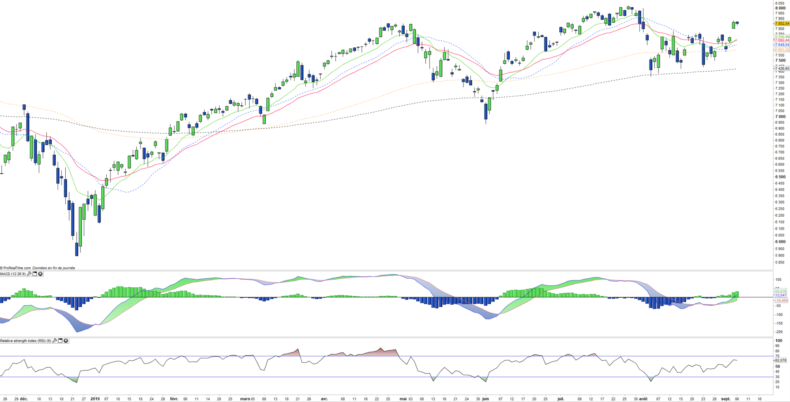
On the daily chart we can see a bullish gap that materialized last week and that allows EMA12 & 26 to cross upward. To be validated, this gap will have to resist 2 or 3 days, while the pressure of the sellers should be felt. The filling or not of this gap next week will be key to judge the strength of the current rebound. In the meantime, it is to be expected that this gap will be tested at the beginning of the week.
Country breakdown
| USA | 100% |
Sector breakdown
| Information technology | 44% |
| Communication services | 22% |
| Consumer discretionary | 16% |
| Health Care | 7% |
| Consumer staples | 6% |
| Industrials | 2% |
| Others | 1% |
Top Ten holdings
| Microsoft | 11% |
| Amazon | 10% |
| Apple | 10% |
| Alphabet | 8% |
| 5% | |
| Intel | 3% |
| Cisco | 3% |
| Comcast | 2% |
| PepsiCo | 2% |


