Indice CAC40 (PX1): Bullish breakout looks now unavoidable

CAC40 (PX1) - 16/09/19

Short Term trend: Neutral (100/100)
Long Term trend: Positive (100/100)

(scores computed by our proprietary algorithms - cf methodology)

Indice profile

It should be noted that the top 10 stocks (which represent about 55% of the index) belong to very different sectors, unlike the DAX (overweight in industrial stocks) or the FTSE100 (pharmacy and financial), the CAC40 is indeed more composite in its sectoral composition. However, three heavily weighted stocks, Total (9­.6%), LVMH (8.3%) and Sanofi (7.1%) can influence the index according to their own fundamental factors, which represents a bias in values.

From a sectoral point of view, we can see that the consumer goods sector represented by luxury goods and cosmetics such as LVMH or Loréal, is one of the most important for the index (20%) behind the industry (21%), ahead of financials (10%) or energy (10%).

The CAC40's values ​​are often world leaders with a very international exposure, with little dependence on the domestic market and with a fairly strong dollar sensitivity.

In 2017, the CAC40 achieved a performance of 9.3% which was more than offset by a -11% in 2018. Since January 2019, the index has risen sharply (+ 19.6%), despite high volatility linked to the accumulation of risks on global growth, with the persistence and aggravation of tensions between China and the US but also with strong support from central bank stimulus and perhaps state backing, while equities remain significantly more attractive than bonds.

Instruments : CAC (Lyxor in Euro), C4D (Amundi in Euro), E40 (BNP Easy in Euro)

Technical analysis

Monthly data analysis

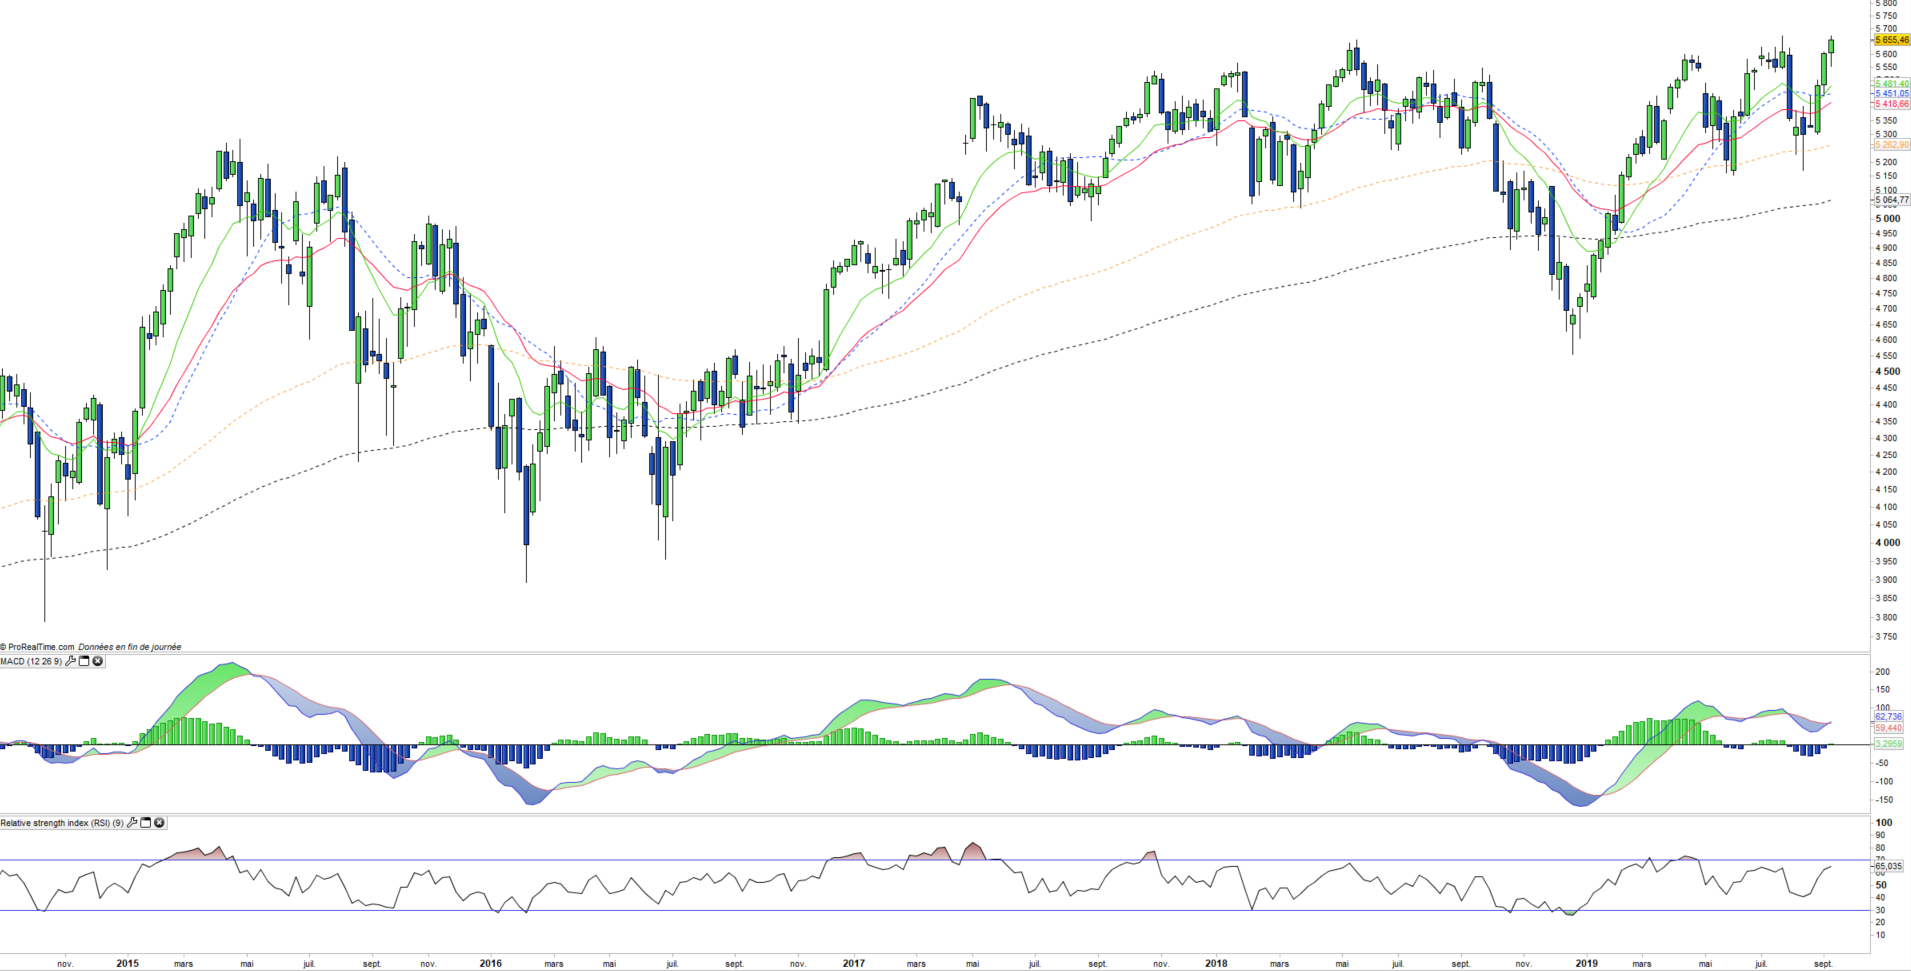
The monthly data show a new attempt to break the range, this time more credible than the previous ones because of the technical context. In the first place, the bullish reversal of the monthly MACD represents a very strong technical support. Then the doji of the month of August coupled with the strong September’s candlestick form a bullish figure. Finally there is no overbought technical indicators unlike previous attacks of 2017. All technical elements are together for a breakout that remains to be confirmed.

Weekly data analysis

The weekly chart shows the arrival of the index on the major resistance of 5670 pts. The index forms a double dip, a bullish figure in case of bullish crossing of the neck line. Another positive factor is the weekly MACD, which is reversing on the upside. The index is far from overbought, and the rise seems far from exhausted when it arrived on the resistance that seems weakened by being tested. Moving averages are up, which increases the upward pressure. An exit from the range seems imminent.

Country breakdown

France 97%
Switzerland 1%
Luxembourg 1%
United Kingdom 1%

Sector breakdown

Industrials 21%
Consumer discretionary 20%
Consumer staples 13%
Energy 10%
Financials 10%
Healthcare 7%
Materials 5%
Others 14%

Top Ten holdings

Total 9%
LVMH 8%
Sanofi 7%
Airbus 6%
L'Oreal 5%
BNP Paribas 4%
Air Liquide 4%
Danone 4%
Vinci 4%
Safran 4%