The Nikkei 225 index is very deep and fairly representative of the Japanese economy.
The industry in all its forms (consumer cyclical, heavy industry ...) is strongly represented in the index (overall about 41%) with a health sector at about 10%, while the technology sector is quite important and represents 16% of the index.
In the first 10 capitalizations we will find growth companies like Fast Retailing Softbank or Kyocera. The Japanese economy is the third largest in the world, behind the US and China, with a GDP of about $ 5000 billion, a highly diversified economy based on services and industry / advanced technology and whose model of growth is based on exports of consumer goods (automotive, technological goods) of capital goods and infrastructure, which is somewhat similar to that of Germany.
The Japanese economy is quite dependent on the evolution of its currency with the main world currencies (Dollar, Euro, Renminbi, Sterling), while the most important problem remains that of the deflation which lasts for two decades. This deflation first came from a time adjustment of the price of assets that had entered a bubble (1980s), but it is also due to a structural problem linked to the declining demography not compensated by immigration.
Japan is today the most indebted country in the developed world but the national debt is held by the Japanese and not by foreign funds which limits the risk of financial crisis, but which, on the other hand, forces the economic recovery.
The reassuring news from China and the deepening of the economic partnership with India, however, are favorable factors while the current valuations of the Japanese index are still reasonable with a potential for high earnings growth.
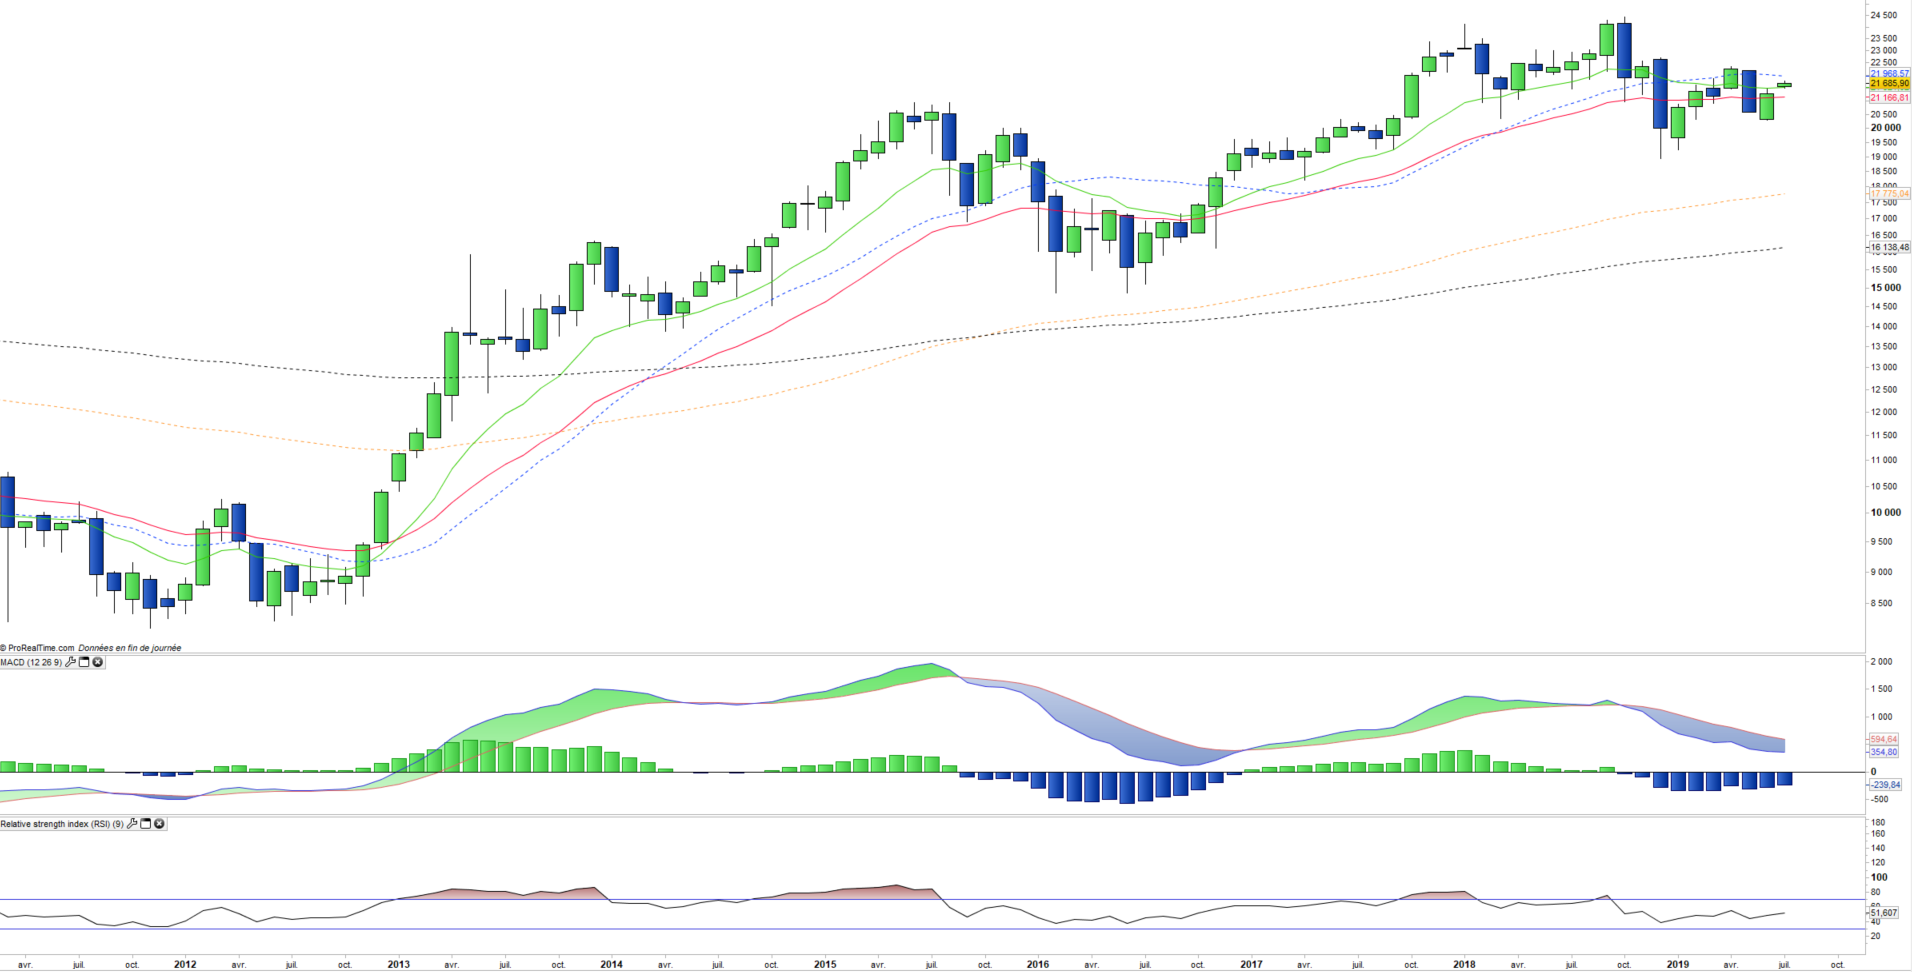
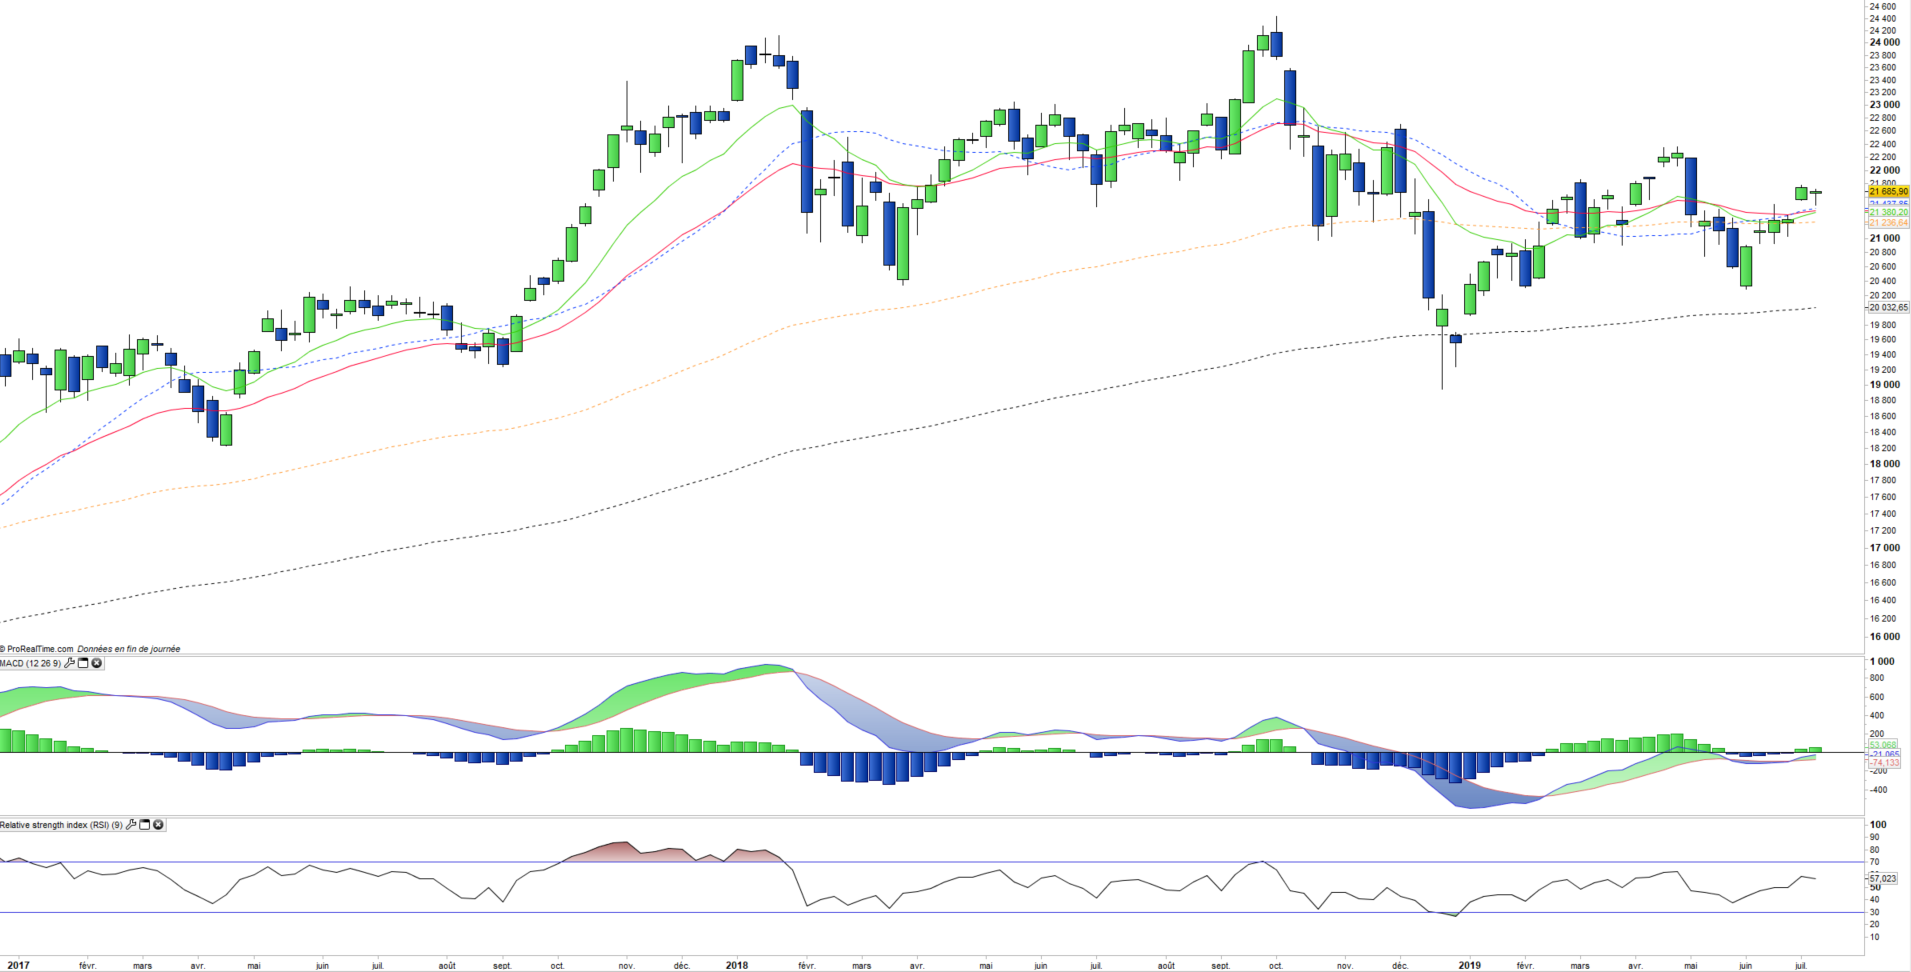
After rising 10% in 2017, the Nikkei225 index fell by 5% in 2018 due to fears about global trade. The rebound has been there since the beginning of the year and the index is up + 8% in 2019, nevertheless down sharply compared to the S&P500 (+ 20% since the beginning of the year) or the Stoxx600 (+ 17%). A catch-up is possible in case of favorable evolution on the trade.
The evolution of the YEN / USD parity is quite stable but rather downward, which is an asset for the Japanese exporting companies.
Instruments : CSNKY (iShares JPY), JPN (Lyxor en Euro), EWJ (iShares en USD)